
How to Reduce Survey Bias From Sampling to Interpretation
Use a full survey bias checklist covering who is reached, question wording, order, nonresponse, cleaning, and reporting.

Survey bias is a systematic reason your results may differ from the truth you are trying to describe. It can enter long before analysis and remain even with thousands of responses. A useful review follows the full path from research question to published claim.
Use a bias audit at each stage
Begin with the target population. Who is missing from the contact list, platform, language, or device path? A survey sent to current subscribers cannot explain the views of people who never subscribed. Next review the invitation: does it appeal especially to people with extreme opinions or promise a reward that changes eligibility behavior? Then review the form: are the words, examples, and choice order pushing respondents toward one interpretation?
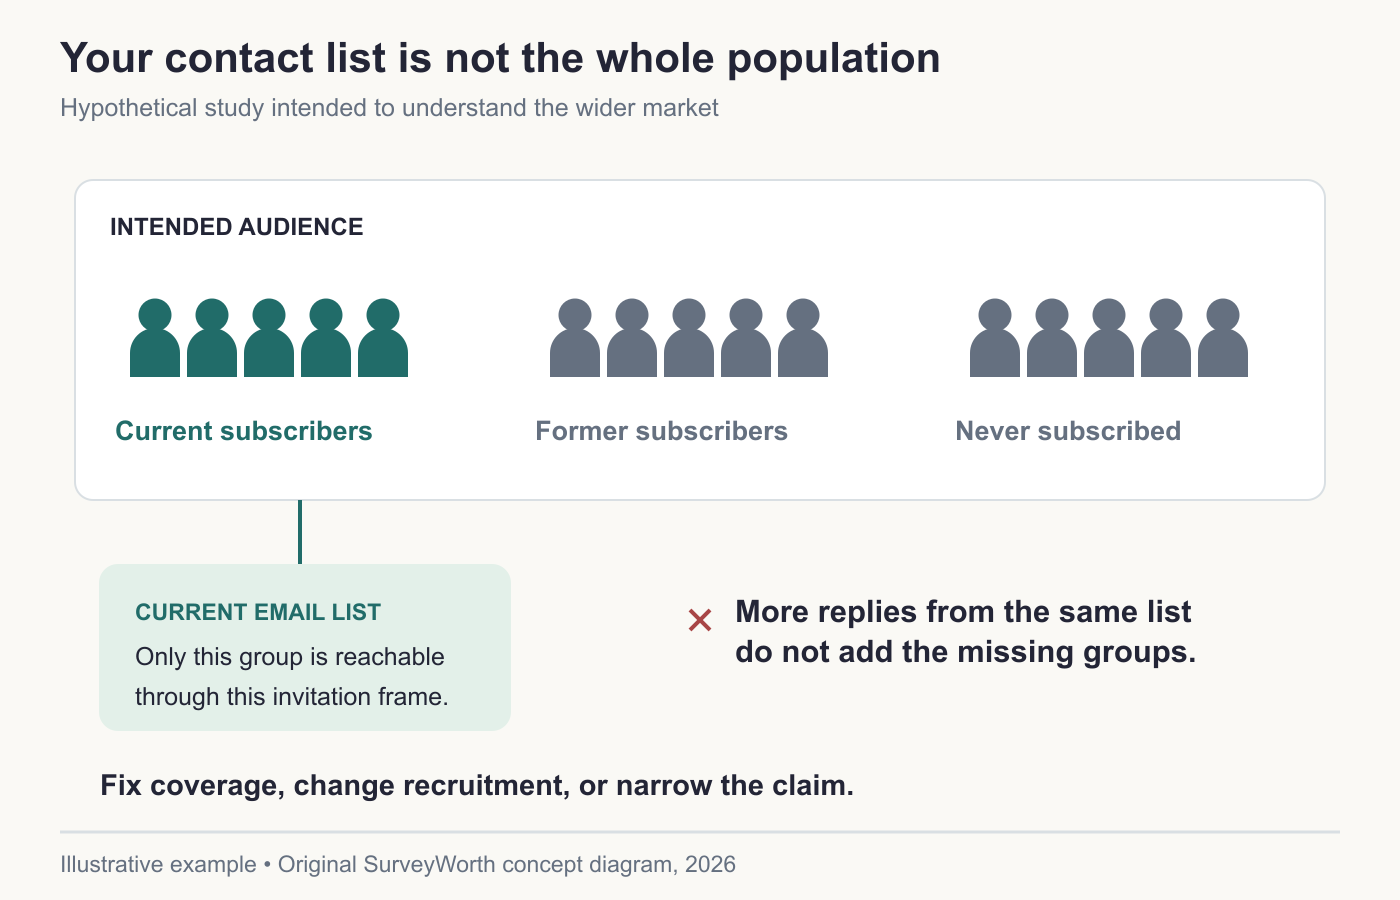
Image source: Original SurveyWorth conceptual diagram, 2026. Illustrative, not observed data or a product screenshot. Based on “Use a bias audit at each stage”.
Bias can also come from who does not answer. If people with unresolved support cases are more likely to respond, the overall satisfaction score may be lower than the full customer population’s. If only enthusiastic community members answer a product concept survey, interest may be overstated. A larger sample of the same self-selected group does not solve that mismatch.
Check questionnaire effects
Ask one construct at a time. A question about “speed and quality” cannot tell you which dimension drove the answer. Put unaided recall before a list of brand names. Ask an overall rating before a detailed complaint checklist when you want an unprompted evaluation. Balance positive and negative options and include a truthful “Not applicable” where needed. Test the wording with people who were not involved in writing it.
Mode can matter. A wide grid may work differently on desktop and phone. A public social poll can feel different from a private email form. If you combine modes, compare their response patterns and document any presentation differences. A question that technically renders everywhere may still be harder to answer on a small screen.
Audit analysis decisions
Before fielding, decide eligibility, duplicate, incomplete-response, and quality rules. Document any weighting and the variables it adjusts. Do not remove outliers only because they conflict with the expected story. If a subgroup is small, report its base and avoid confident claims from a handful of answers. If you test many subgroup differences, treat unexpected patterns as leads for follow-up rather than definitive discoveries.
Suppose a convenience survey finds that 70% of respondents favor a new feature. A fair conclusion is that 70% of this respondent group selected favor under this question wording. It is not enough to claim 70% of U.S. buyers want the feature. To support a broader claim, revisit the sampling frame, nonresponse, and whether stated preference predicts behavior.
Report uncertainty in plain language
Readers should be able to see who answered, how they were reached, when they answered, how the question was phrased, and what alternative explanations remain. A limitations paragraph does not invalidate useful findings; it tells decision-makers which action can be taken confidently and which result needs another test. This is how a survey becomes a trustworthy input rather than a decorative number.
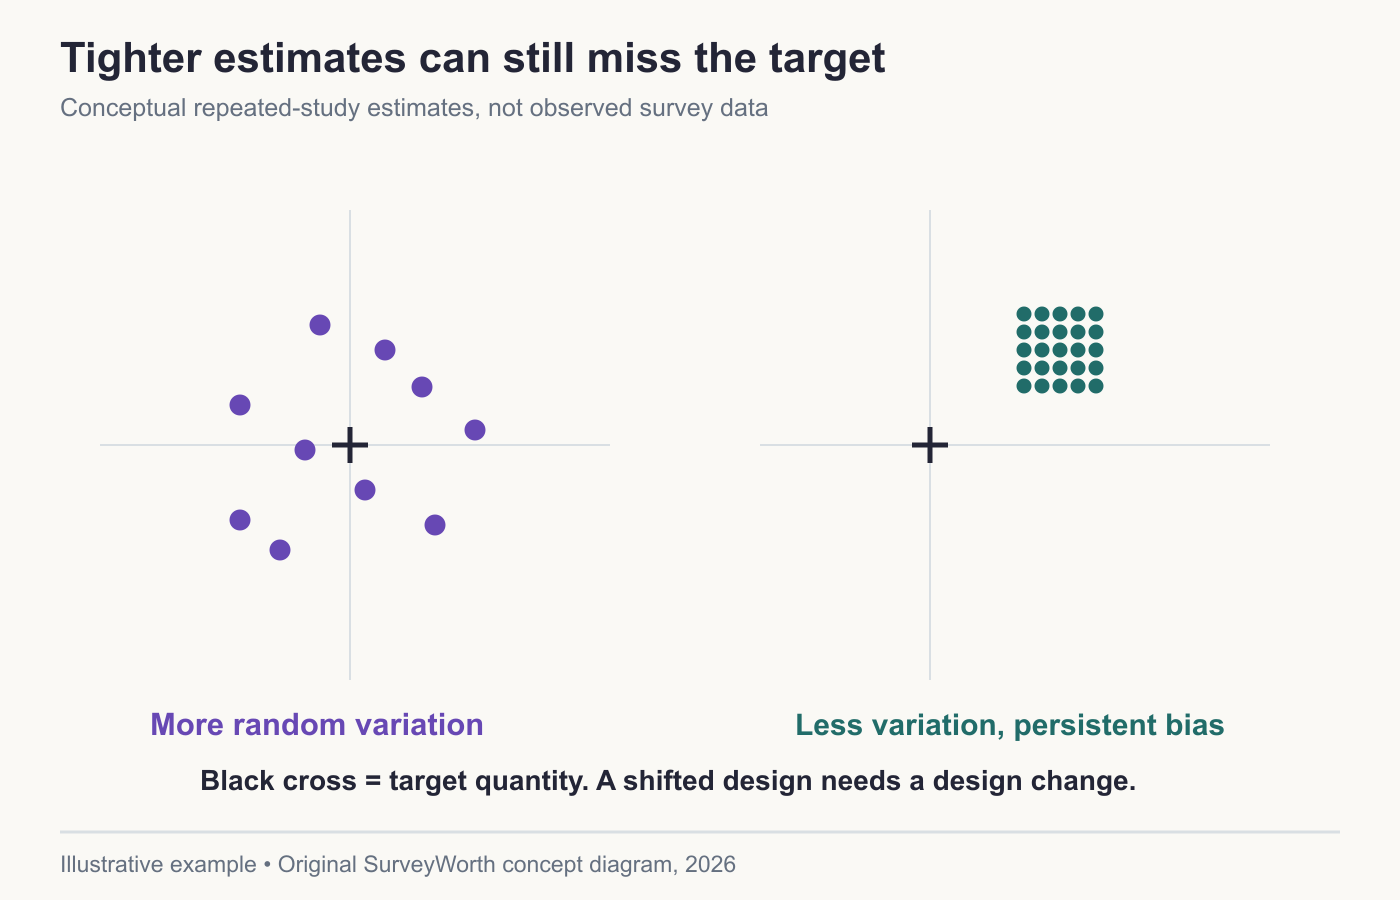
Image source: Original SurveyWorth conceptual diagram, 2026. Illustrative, not observed data or a product screenshot. Based on “Report uncertainty in plain language”.
Use a claim ladder
At the lowest rung, you can describe what the respondents selected. A stronger claim compares meaningful groups within the sample. A population estimate requires a suitable sampling design and attention to nonresponse. A causal claim requires a design that addresses competing explanations. Before publishing, place every headline on this ladder and check whether the study actually supports that rung. This simple review prevents a directional convenience survey from becoming a national claim in a marketing deck.
If the evidence is weaker than the decision requires, do not hide the gap. Use the survey to identify a next test, change the language of the claim, or improve the sampling plan. Accurate limits are part of useful research.
Audit bias at each handoff
Typeform’s four-step bias review looks beyond wording to assumptions and cleaning decisions, while Alchemer’s bias overview distinguishes selection, measurement, and response effects. A practical review should follow the respondent’s path: Was the person eligible and reachable? Did the invitation frame a preferred answer? Could the person understand the item? Did cleaning remove inconvenient answers? Write one check for each handoff before launch.
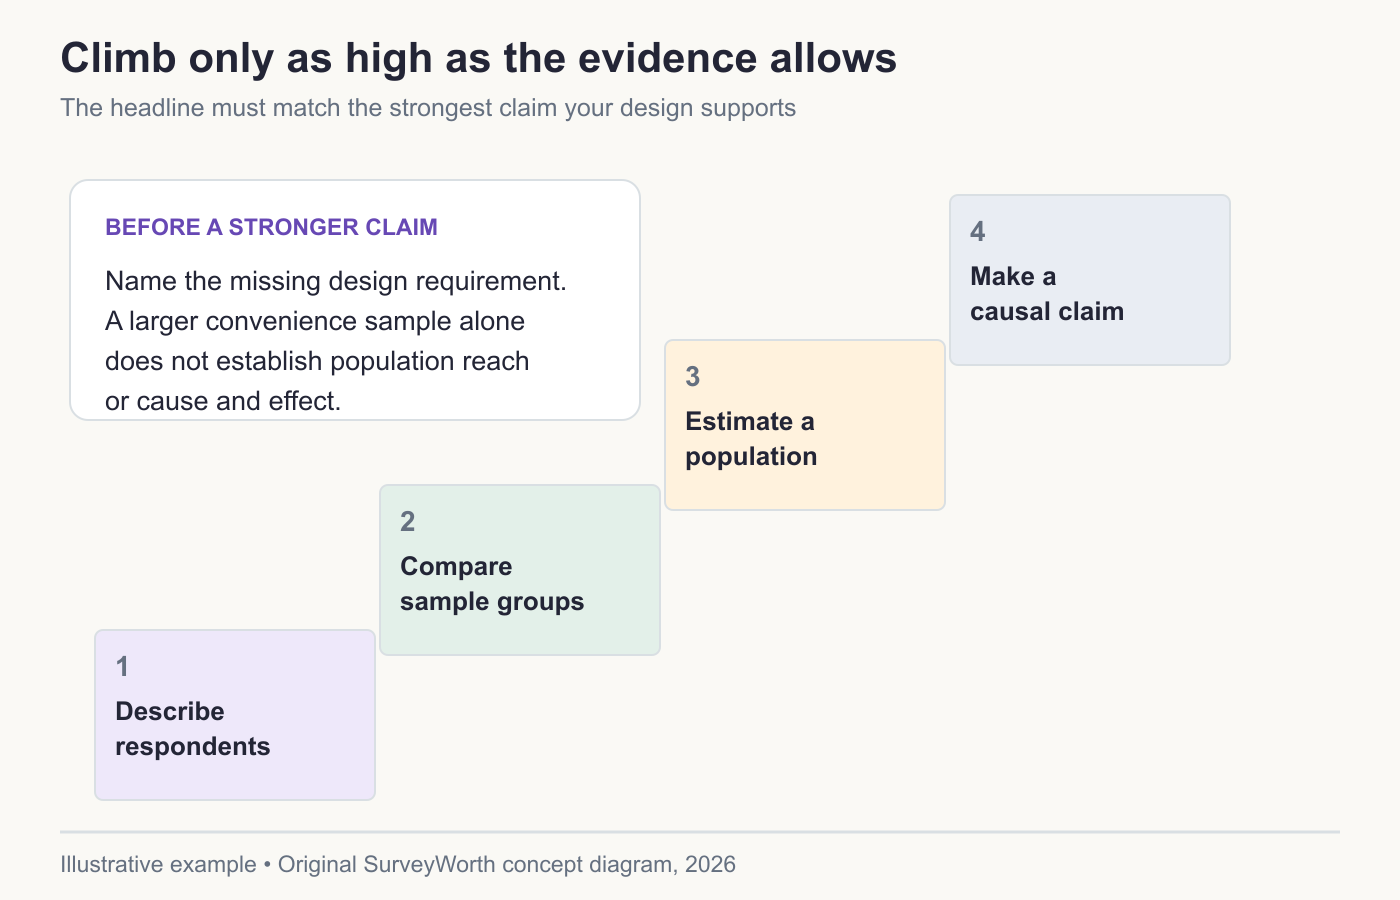
Image source: Original SurveyWorth conceptual diagram, 2026. Illustrative, not observed data or a product screenshot. Based on “Use a claim ladder”.
| Stage | Bias risk | Check |
|---|---|---|
| Invitation | Only highly engaged customers see it. | Compare frame and nonrespondents. |
| Question | “How helpful was our improved support?” presumes help. | Rewrite without the positive premise. |
| Order | Brand list primes unaided recall. | Put recall first. |
| Analysis | A subgroup is removed after results are known. | Freeze rules and show sensitivity. |
A 72% favorable result among email respondents describes that respondent group unless the selection design supports a wider claim. Typeform’s sampling-method comparison is useful when deciding how far the inference can travel. Report the actual base, field dates, selection route, and unresolved threats alongside the number. The sampling guide provides the design choices behind that limitation.
Keep a claim at the strength of its weakest stage
A well-written question cannot repair a list that excludes half the intended customers. A random invitation cannot repair a scale whose positive labels outnumber negative ones. QuestionPro’s bias checklist covers wording, order, and selection, while AAPOR’s best practices require the sampling and fieldwork details needed to interpret a result. Write the intended claim at design time, then revisit it after recruitment, item missingness, and exclusions. If a weakness remains, narrow the claim to the respondents actually represented. For an item-level check, use the neutral-question guide. That is more useful than labeling every percentage “representative” merely because the sample is large.
Frequently asked questions
Does anonymity eliminate bias?
It may reduce pressure to give socially desirable answers in some settings, but it does not fix sampling or wording problems.
Can a huge sample remove bias?
A large sample reduces some random variation. It does not correct systematic coverage or selection errors by itself.
Choose tools for your next survey.
Explore survey creation software and research tools for your project.
Explore survey softwareKeep reading.

How to Test a Marketing Campaign With Surveys
Use surveys before, during, and after a campaign to test message clarity and track audience response without overclaiming causality.
Read the guide
How to Measure Brand Awareness With a Survey
Measure unaided recall and aided recognition with balanced survey questions and careful sampling.
Read the guide
How to Design a Product Testing Survey
Write product concept, prototype, and post-launch survey questions that fit what participants have actually experienced.
Read the guide