
Survey Sampling Methods: Random, Stratified, and Convenience Samples
Compare probability and nonprobability survey sampling methods, their tradeoffs, and the claims each can support.

A sample is the group selected or recruited from a defined population; respondents are the subset who actually answer. The selection method and the pattern of nonresponse both affect what you can infer about the larger population. Before choosing a method, define the population and whether you have a list or other way to reach its members.
Start with the population and frame
The population is the group you want to describe. The sampling frame is the list or process from which you can actually select people. If your population is all U.S. adults who bought a product category this year, your brand’s customer list is incomplete by design. A random draw from that list is random only within the list. Coverage error remains even when selection is mathematically sound.
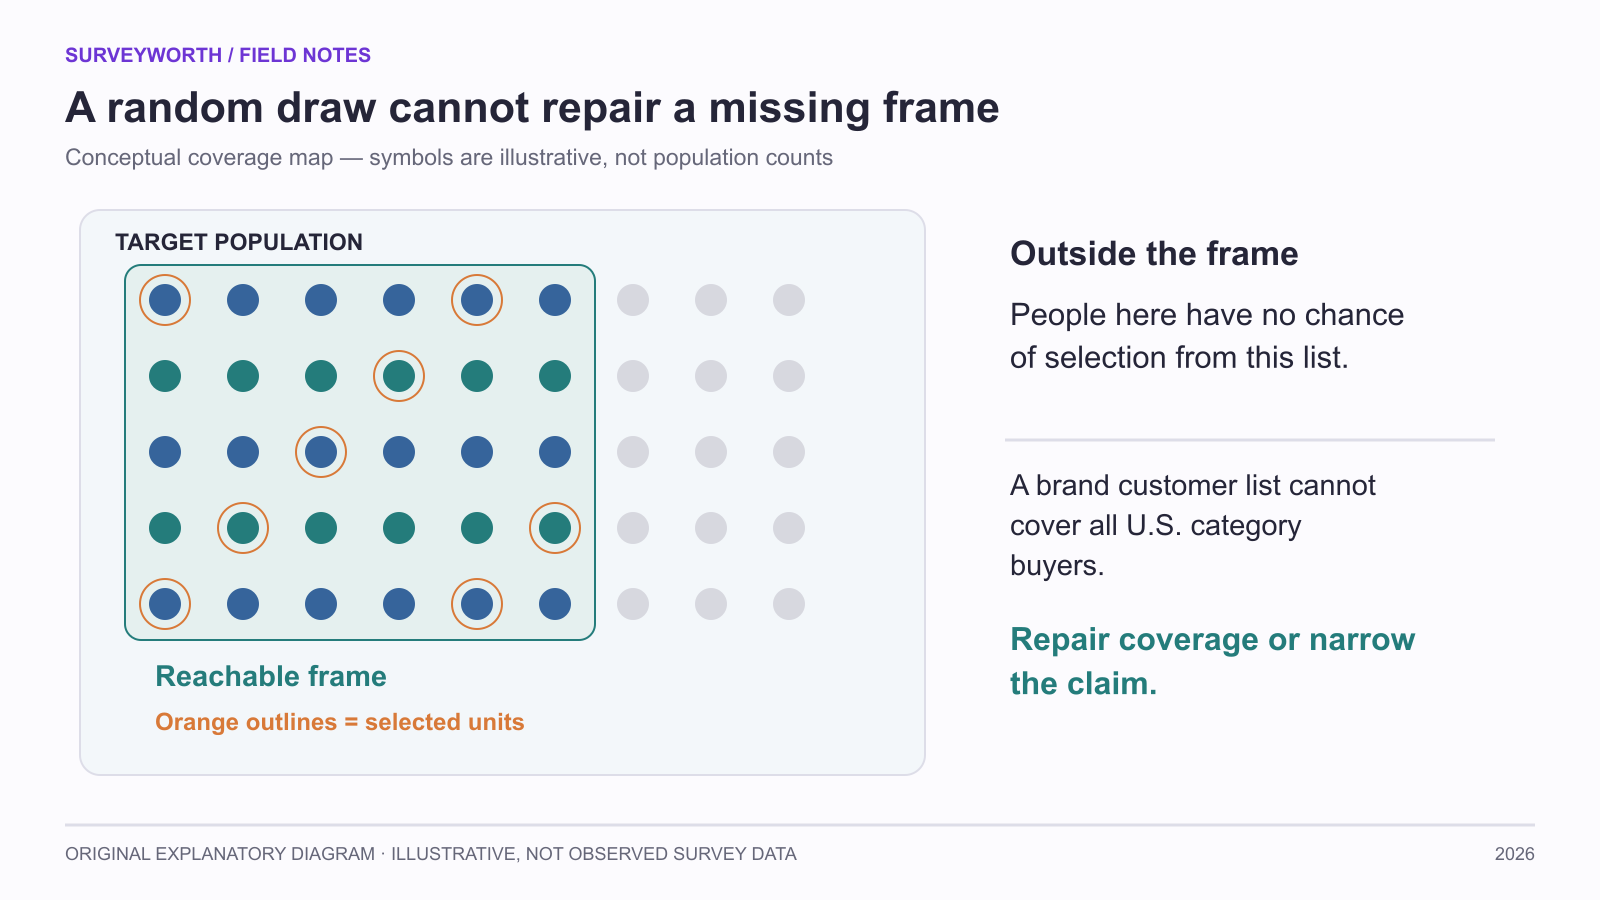
Image source: SurveyWorth original explanatory diagram, 2026. Illustrative, not observed survey data. Based on this article’s “Start with the population and frame” section(s); not a product screenshot.
Write the population in one sentence and then list who the frame omits. If those omissions matter to the decision, change the frame or narrow the claim. For a customer-experience project, a complete customer list may be appropriate. For a market-sizing claim, it usually is not.
How probability designs work in practice
In simple random sampling without replacement, units are selected at random so that all combinations of the required size are equally likely. Each unit in the frame therefore has an equal chance of selection, as explained in Statistics Canada’s sampling guide. Stratified sampling first separates important groups, then samples within them. This can help ensure adequate representation of smaller regions or customer types. Cluster sampling selects groups, such as locations, then members inside them; it can reduce fieldwork cost but creates dependence among responses that must be considered in analysis. Systematic sampling selects at an interval from an ordered list; the list order can introduce a pattern if it aligns with the selection interval.
Probability sampling is not automatically unbiased after invitation. Nonresponse, stale contact information, and measurement error can still matter. Weighting can adjust known imbalances but cannot guarantee that nonrespondents think like respondents within each weighting cell.
When nonprobability designs are useful
Convenience sampling is fast when the objective is to find usability problems or generate hypotheses among reachable people. Purposive sampling deliberately includes people with relevant experiences, such as recent cancellers. Quota sampling can fill categories, but selection within each quota may still be self-selected. Snowball sampling can help reach hard-to-find communities; referrals can concentrate the sample in connected networks.
These designs can produce valuable insights, particularly for exploration. Their limitation is inferential: you generally cannot attach a conventional probability-sampling margin of error or make a confident claim about the whole population solely from the sample size.
Show how the frame determines the claim
Typeform’s sampling-method map compares probability and nonprobability routes; its market-research guide starts with the target audience. Before choosing a method, make a frame coverage table. If the intended population is U.S. customers who used a support portal in October, a complete portal-user list can be sampled, but a marketing-email list omits customers without subscriptions. A random draw from the wrong list remains a random sample of the wrong frame.
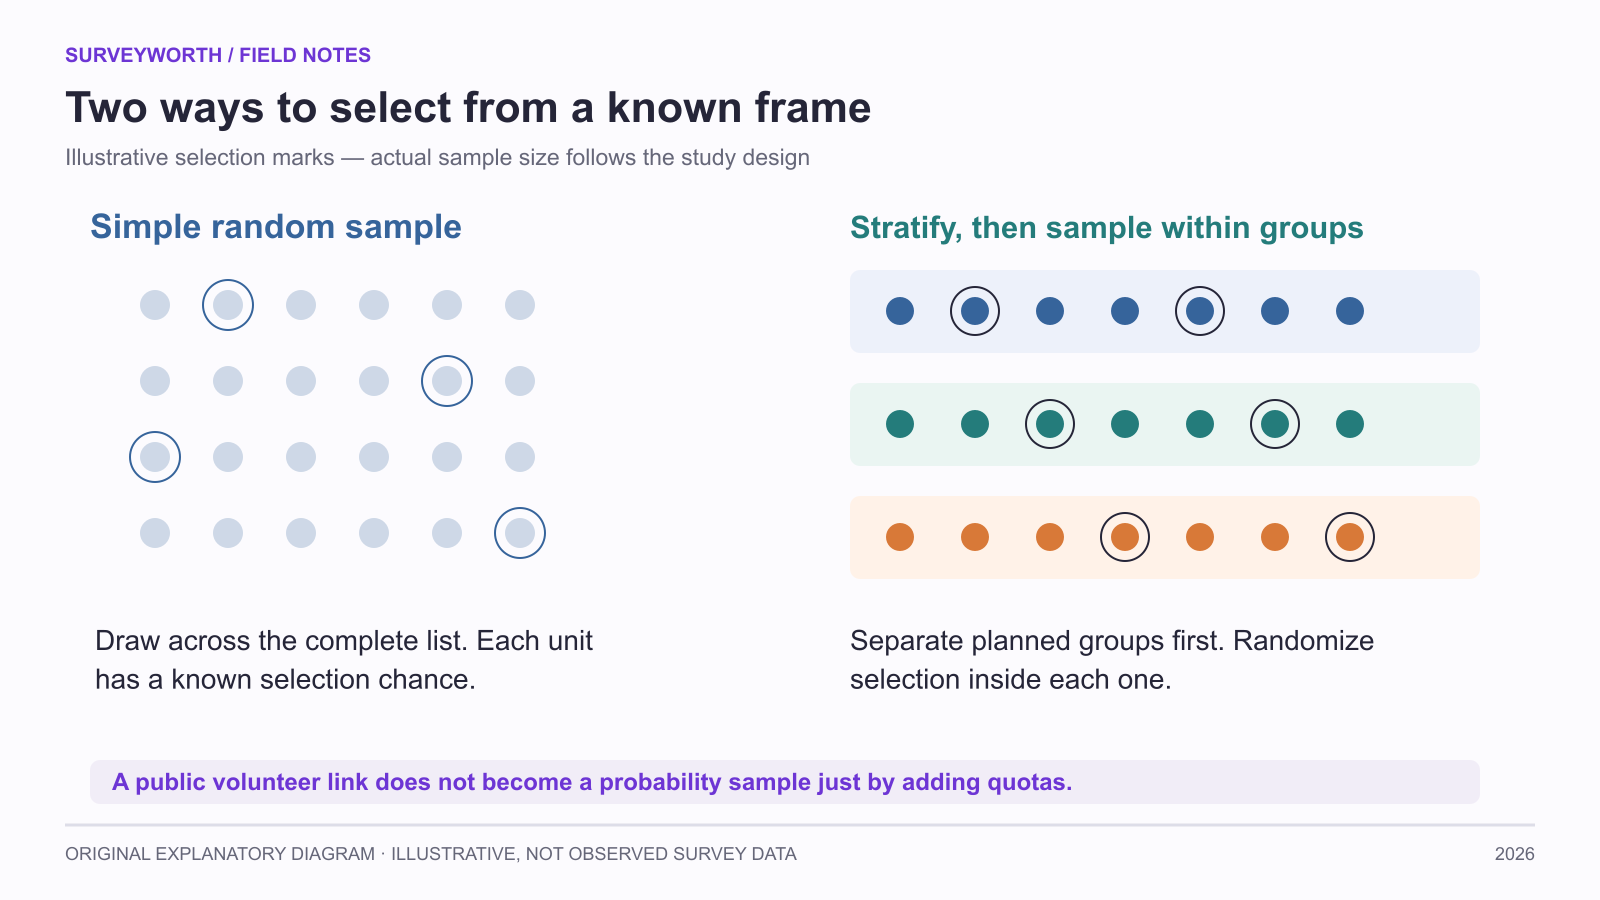
Image source: SurveyWorth original explanatory diagram, 2026. Illustrative, not observed survey data. Based on this article’s “How probability designs work in practice; When nonprobability designs are useful” section(s); not a product screenshot.
| Frame question | Record before sampling |
|---|---|
| Who is included? | Event definition, U.S. eligibility, dates, deduplication. |
| Who is absent? | Anonymous visitors, deleted accounts, tracking gaps. |
| How selected? | Randomization method and selection probability by stratum. |
| What happened after selection? | Invited, unreachable, ineligible, partial, and complete counts. |
QuestionPro’s total-survey-error overview reminds readers that sampling is only one error source. Compare observed respondent mix with known frame variables, but do not claim that weighting repairs unknown differences in motivation. The recruitment guide turns this frame into an invitation plan. If a population estimate will drive a consequential decision, obtain statistical review of the actual design and uncertainty calculation.
Report weighting as a method, not a magic correction
If desktop and mobile users are selected at different rates, document the frame counts, selection probabilities, response counts, variables used, and final weight distribution. AAPOR’s best practices call for disclosure of sampling and weighting; Typeform’s sampling overview provides a reader-friendly map of the designs. Pew Research Center’s published survey methodology illustrates how researchers document weighting steps. Weighting can restore a known device mix but does not reveal the opinions of unreachable visitors. Compare weighted and unweighted estimates, and show when a small subgroup becomes unstable. A statistician should review uncertainty for a clustered or multistage design; a simple-random-sample margin of error may be misleading.
Sample size is not the whole quality question
A large sample can reduce random variation while leaving a major coverage gap. Before calculating a target number, decide how precise the estimate must be for the decision, how many subgroup comparisons are planned, and what response rate is plausible. If the study is exploratory, the target may be driven by the range of experiences needed rather than a statistical margin. Record the rationale either way.
A probability design also requires appropriate analysis. Stratification, clustering, and weighting change how uncertainty should be calculated. A simple online calculator that assumes an independent simple random sample can understate uncertainty for a complex design. If the result will support a high-stakes population claim, involve a survey statistician early. For a convenience sample, describe patterns in the respondent group and use follow-up research instead of attaching a misleading margin of error.
Report design and response together
A methods note should state how people were selected and what happened after selection. “Randomly invited 1,000 customers” is incomplete if only a narrow subgroup answered. Include invited, reachable, eligible, and completed counts where available, along with any known differences between respondents and the frame. Selection quality and response behavior jointly determine how far the result can travel.
Worked stratified-sample allocation
Suppose a hypothetical customer frame has 8,000 recent users: 6,000 desktop and 2,000 mobile. For a planned sample of 400 using proportional stratification, randomly select 300 desktop users and 100 mobile users within the respective complete lists. The arithmetic is 400 × 6,000/8,000 = 300 and 400 × 2,000/8,000 = 100. If mobile experience is the main decision, you might instead select 200 from each stratum; that oversamples mobile users and the combined estimate then needs design weights and clear reporting.
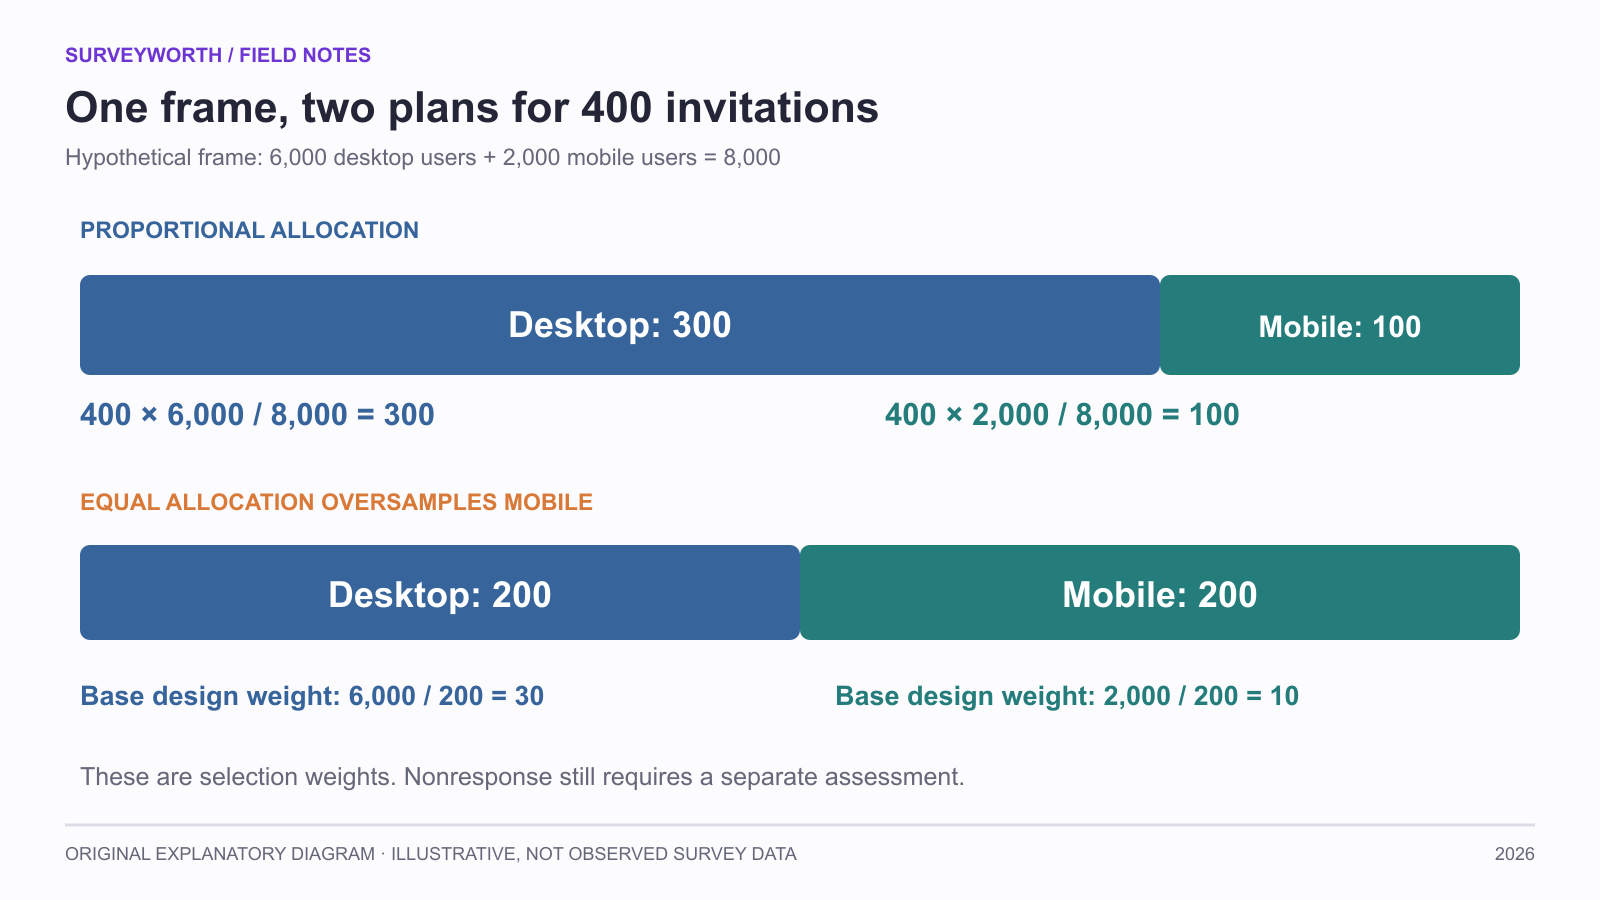
Image source: SurveyWorth original explanatory diagram, 2026. Illustrative, not observed survey data. Based on this article’s “Worked stratified-sample allocation; Report weighting as a method, not a magic correction” section(s); not a product screenshot.
Selection alone does not guarantee the achieved response mix. If 120 desktop and 30 mobile people respond in the proportional design, calculate results with the response pattern and nonresponse limitation visible. Weighting may adjust known frame differences, but it cannot prove that respondents and nonrespondents are alike on unmeasured outcomes. Keep the population counts, random-selection method, invitations, eligibility rules, and achieved completes for each stratum. Do not attach a standard probability margin of error to a convenience sample simply because its respondent count is large.
Frequently asked questions
Is a larger convenience sample better than a smaller random sample?
It may reveal more themes, but size alone does not remove selection bias. The answer depends on the decision and the population claim.
Can I calculate a margin of error for any online survey?
A conventional sampling margin of error assumes a probability design and does not capture all sources of survey error.
Choose tools for your next survey.
Explore survey creation software and research tools for your project.
Explore survey softwareKeep reading.

How to Test a Marketing Campaign With Surveys
Use surveys before, during, and after a campaign to test message clarity and track audience response without overclaiming causality.
Read the guide
How to Measure Brand Awareness With a Survey
Measure unaided recall and aided recognition with balanced survey questions and careful sampling.
Read the guide
How to Design a Product Testing Survey
Write product concept, prototype, and post-launch survey questions that fit what participants have actually experienced.
Read the guide