
What Is NPS? Formula, Example Survey, and Common Mistakes
Understand the Net Promoter Score formula, a basic NPS survey, follow-up questions, and interpretation limits.

Net Promoter Score, or NPS, summarizes answers to a recommendation question: “How likely are you to recommend [company or product] to a friend or colleague?” Respondents select a number from 0 (not at all likely) to 10 (extremely likely). The score is a descriptive metric, not a complete explanation of loyalty.
Plan the follow-up question
A reason prompt should be neutral: “What is the main reason for your rating?” Avoid “What should we do to make you a promoter?” because it frames the respondent through the metric rather than the experience. Code reasons into themes such as reliability, value, support, or missing capability, but retain the actual text to understand each theme.
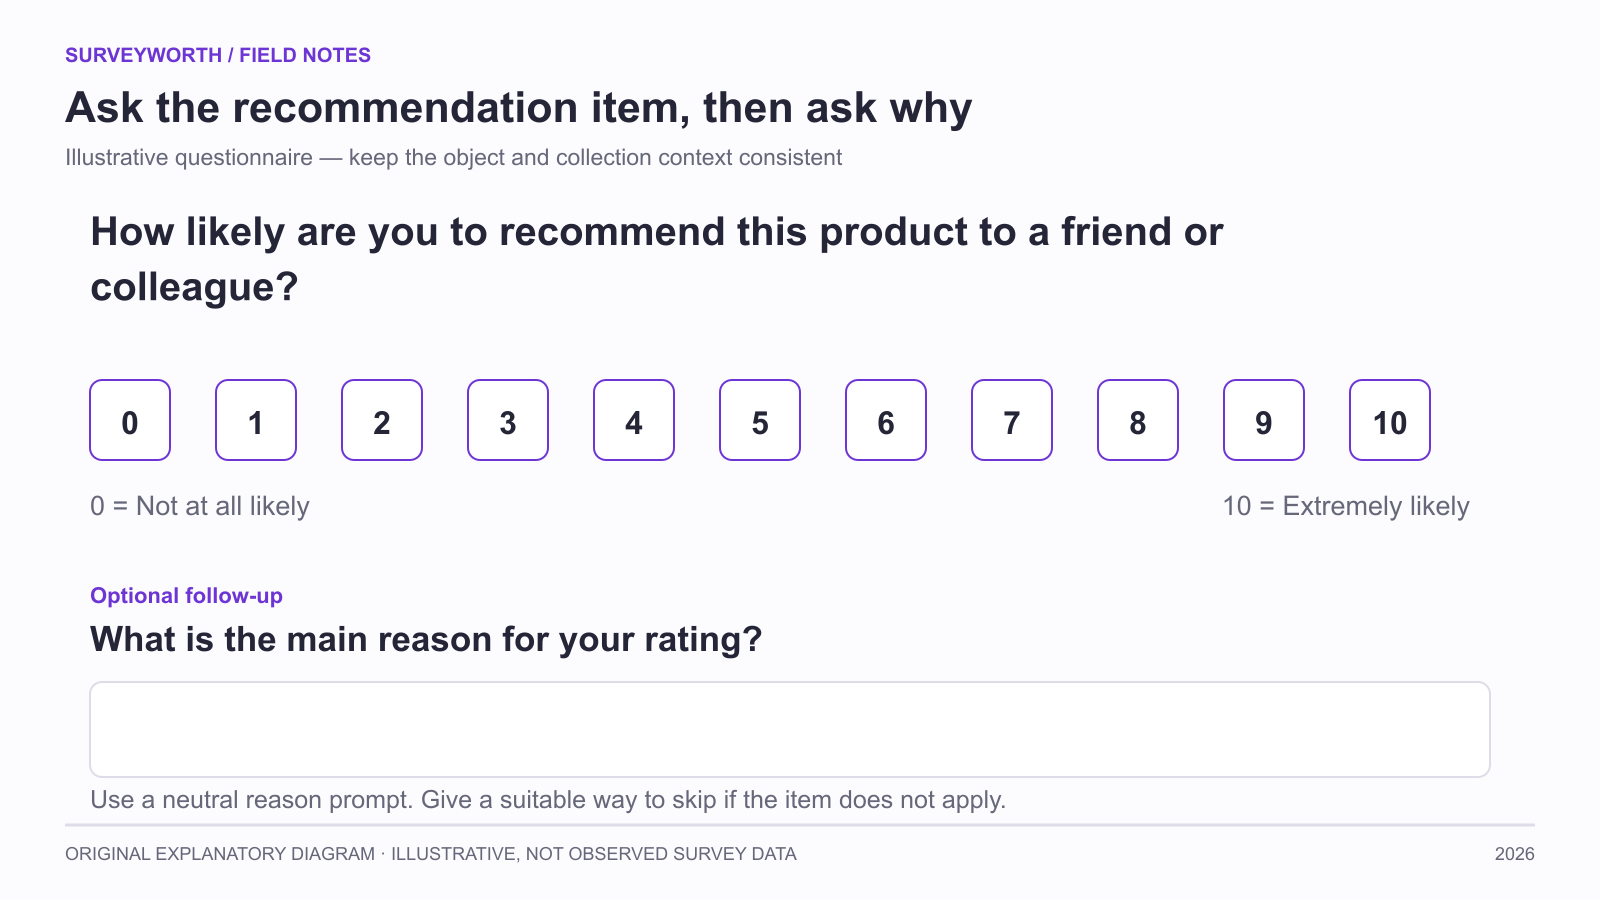
Image source: SurveyWorth original explanatory diagram, 2026. Illustrative, not observed survey data. Based on this article’s “Plan the follow-up question; One complete NPS calculation and questionnaire” section(s); not a product screenshot.
If respondents are identifiable and have agreed to contact, a team can follow up on specific problems. If the survey is anonymous, report aggregate themes and do not imply that individual cases can be resolved. A detractor score is a cue to investigate, not a diagnosis.
Use NPS as a trend with controls
Collect at a consistent point in the relationship. A recommendation question right after a successful transaction will differ from one sent during a billing dispute. Track invitation channel, customer tenure, and response composition. If the sample shifts toward new users, an apparent trend may reflect audience mix. Report the counts behind a score, especially for small groups.
NPS is not a universal predictor of revenue or loyalty. Recommendation intent is self-reported and may be shaped by category norms. Validate its usefulness against actual retention, referral, or purchase behavior in your own setting. When benchmarking externally, check whether the other score uses the same country, audience, time period, and method; otherwise the comparison can mislead.
Interpret extreme movement cautiously
A small sample can move sharply when only a few people change category. With 20 respondents, moving two people from detractor to promoter shifts NPS by 20 points. That arithmetic is why a team should show the sample and category counts, especially in subgroup charts. If a segment is too small for a stable trend, combine periods when appropriate or use qualitative reasons as leads rather than publicizing a precise score.
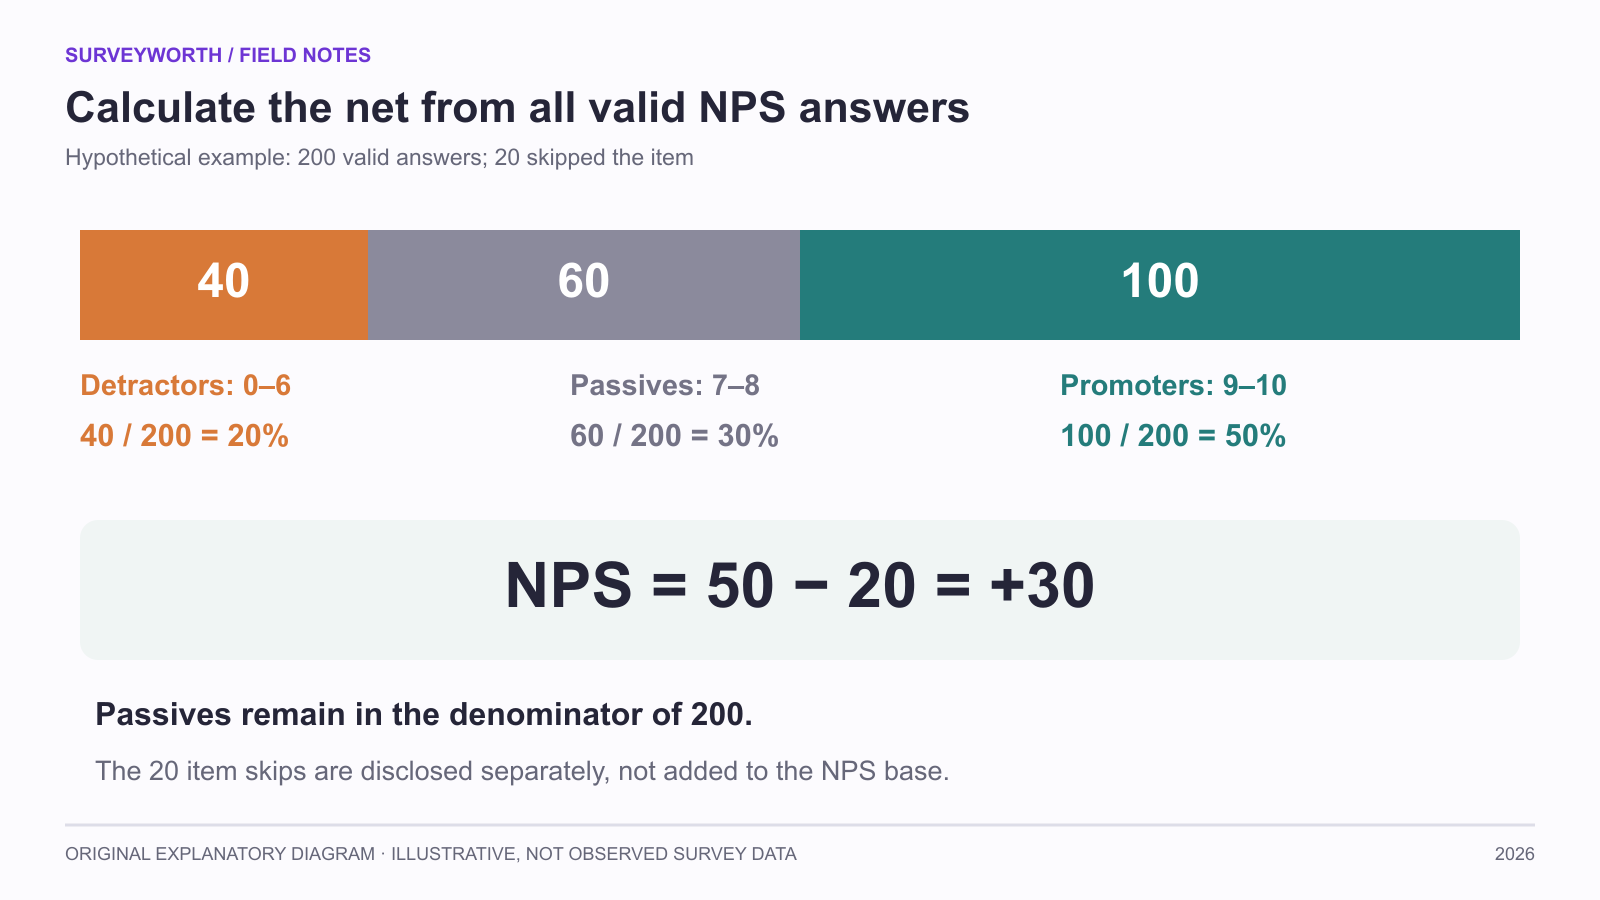
Image source: SurveyWorth original explanatory diagram, 2026. Illustrative, not observed survey data. Based on this article’s “One complete NPS calculation and questionnaire; Read the distribution before the net score” section(s); not a product screenshot.
Also record whether the question was asked after a transaction or as a relationship survey. The two contexts can produce different answers and should not be mixed into a single trend without careful labeling.
One complete NPS calculation and questionnaire
The standard recommendation item asks: “How likely are you to recommend [specific company or product] to a friend or colleague?” Show every integer from 0 to 10, with 0 labeled “Not at all likely” and 10 “Extremely likely.” Follow it with one optional prompt: “What is the main reason for your rating?” If someone cannot reasonably recommend the product, give an appropriate way to skip rather than inventing a score.
For an illustrative 200 valid item answers, 100 scores are 9–10, 60 are 7–8, and 40 are 0–6. Promoters are 100/200 = 50%; passives are 60/200 = 30%; detractors are 40/200 = 20%. NPS = 50 − 20 = +30. Passives remain in the denominator. A report should show all three counts, the sample and field period, and how many people were invited. If 20 people skipped the item, those 20 are not silently included in the NPS denominator. Avoid comparing this number with a differently sampled or differently worded survey as though the change were a product effect.
Read the distribution before the net score
QuestionPro’s NPS explanation defines promoters as 9–10, passives as 7–8, and detractors as 0–6. Alchemer’s critical review of NPS discusses the metric’s limits, while Involve.me’s detractor follow-up article focuses on what can happen after a low score. A responsible report shows all three groups, valid item base, field date, invitation source, and exact object rated. A +20 score can result from 30% promoters and 10% detractors, or 55% promoters and 35% detractors; those distributions imply different follow-up questions.
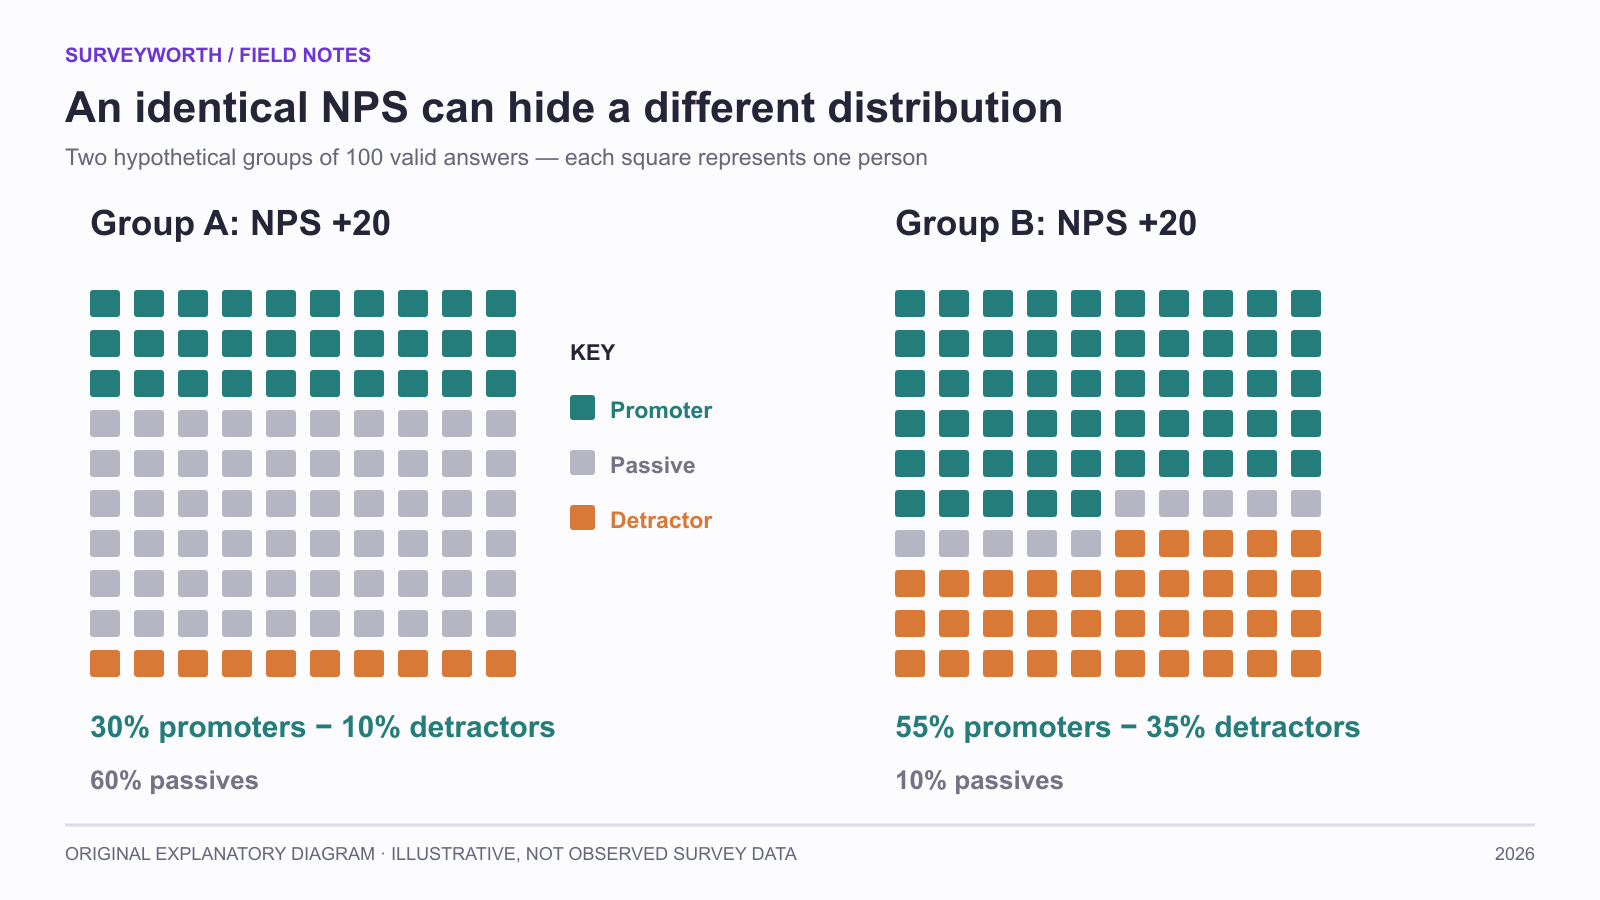
Image source: SurveyWorth original explanatory diagram, 2026. Illustrative, not observed survey data. Based on this article’s “Read the distribution before the net score; Use NPS for a question it can answer” section(s); not a product screenshot.
| Report line | Why it belongs |
|---|---|
| Valid NPS answers and item skips | Prevents silent changes in the denominator. |
| Promoter, passive, detractor counts | Reveals polarization hidden by the net. |
| Relationship or transaction wording | Prevents unlike series from being spliced. |
| Open reason by score group | Identifies what to investigate next. |
Do not claim that one detractor will churn or one promoter will refer someone. Recommendation intent is not observed behavior. If a service team needs to know whether an issue was solved or how hard it was, the metric comparison explains why CSAT or CES may answer the immediate decision more directly.
Use NPS for a question it can answer
If a team wants to know whether a new help article reduces effort, a task-specific CES or completion measure is closer to the decision than a company-wide recommendation question. Bain’s NPS explanation gives the metric’s relationship framing, while Qualtrics’s CES overview focuses on the ease of a specific task. Keep relationship and transaction NPS in separate series, with the object and timing visible. If a score moves, inspect respondent mix, category counts, and reasons before attributing it to a release. The result-analysis guide provides a denominator and subgroup checklist. Validate any loyalty or referral claim against observed behavior in that organization rather than assuming the score predicts it.
Frequently asked questions
Is 7 or 8 a detractor?
No. In the standard NPS calculation, 7 and 8 are passives.
Should I compare my NPS with another company’s?
Only with care. Different audiences, collection methods, and question contexts can make direct comparisons misleading.
Choose tools for your next survey.
Explore survey creation software and research tools for your project.
Explore survey softwareKeep reading.

How to Test a Marketing Campaign With Surveys
Use surveys before, during, and after a campaign to test message clarity and track audience response without overclaiming causality.
Read the guide
How to Measure Brand Awareness With a Survey
Measure unaided recall and aided recognition with balanced survey questions and careful sampling.
Read the guide
How to Design a Product Testing Survey
Write product concept, prototype, and post-launch survey questions that fit what participants have actually experienced.
Read the guide