
How to Analyze Survey Results: Cleaning, Crosstabs, and Reporting
Turn raw survey responses into a defensible report with data checks, descriptive summaries, subgroup comparisons, and clear limits.
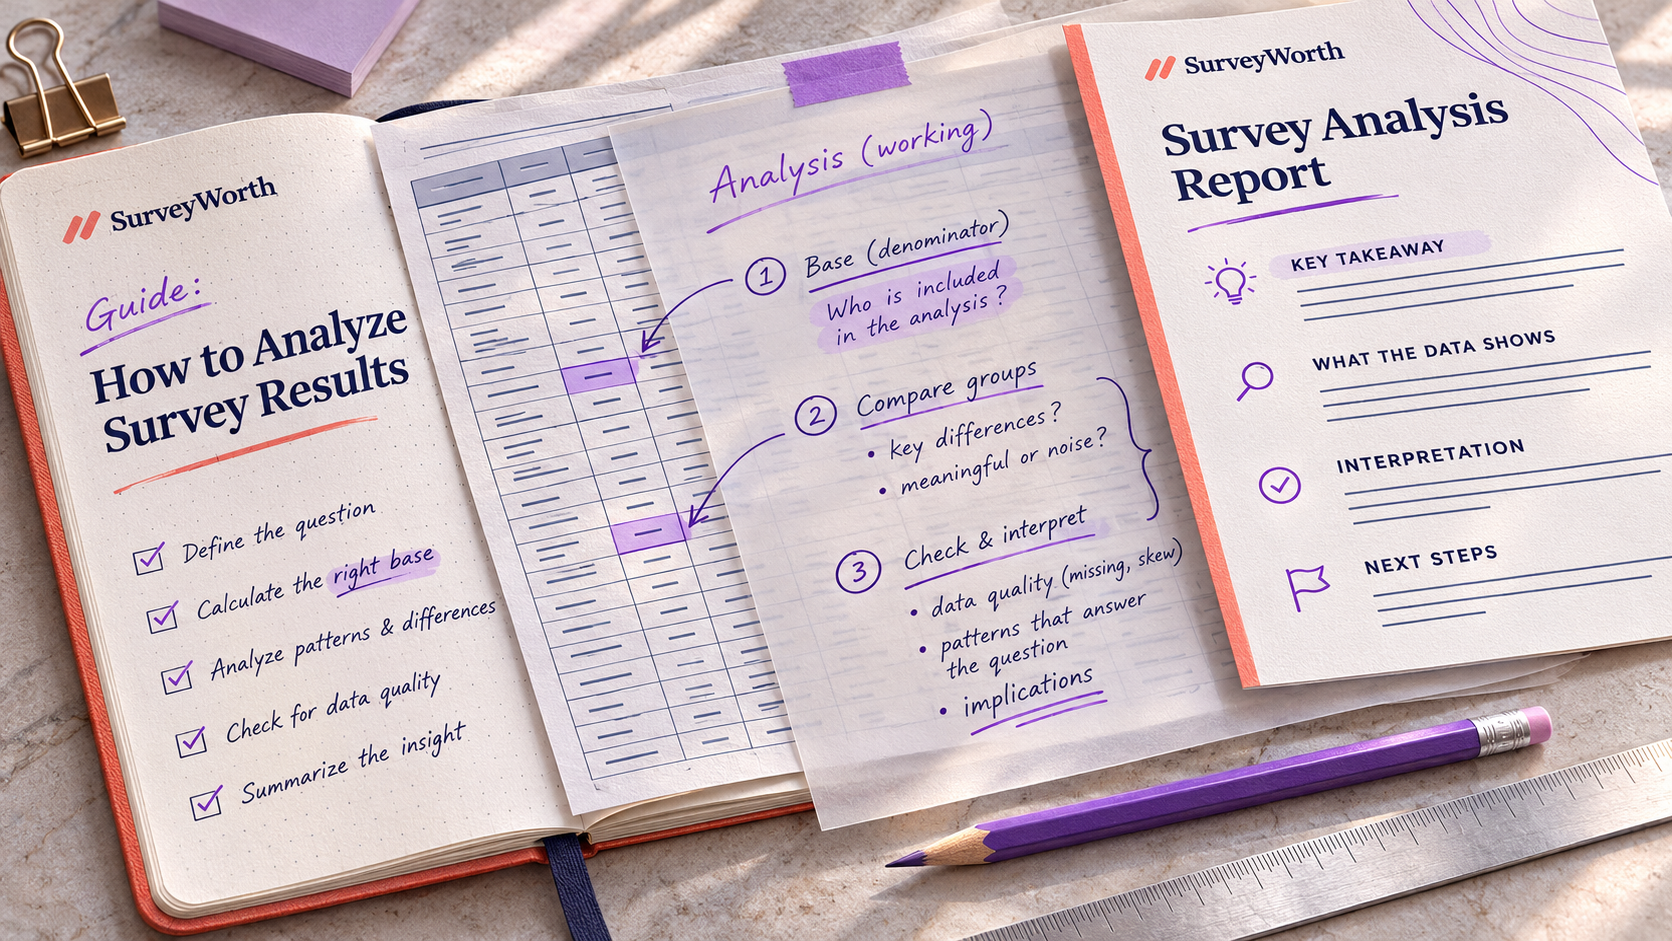
Survey analysis starts before the first response. Decide which outcomes matter, which groups you will compare, and what action each result may inform. Then preserve the exact question wording and survey version so the numbers remain interpretable.
Build a reproducible analysis file
Keep the untouched export and create a working copy. Add a data dictionary containing each question’s full text, response codes, branch conditions, and survey version. Mark whether an empty cell means the question was not shown, was shown and skipped, or was lost through an export error. Those meanings should never be collapsed into one “missing” category without explanation.
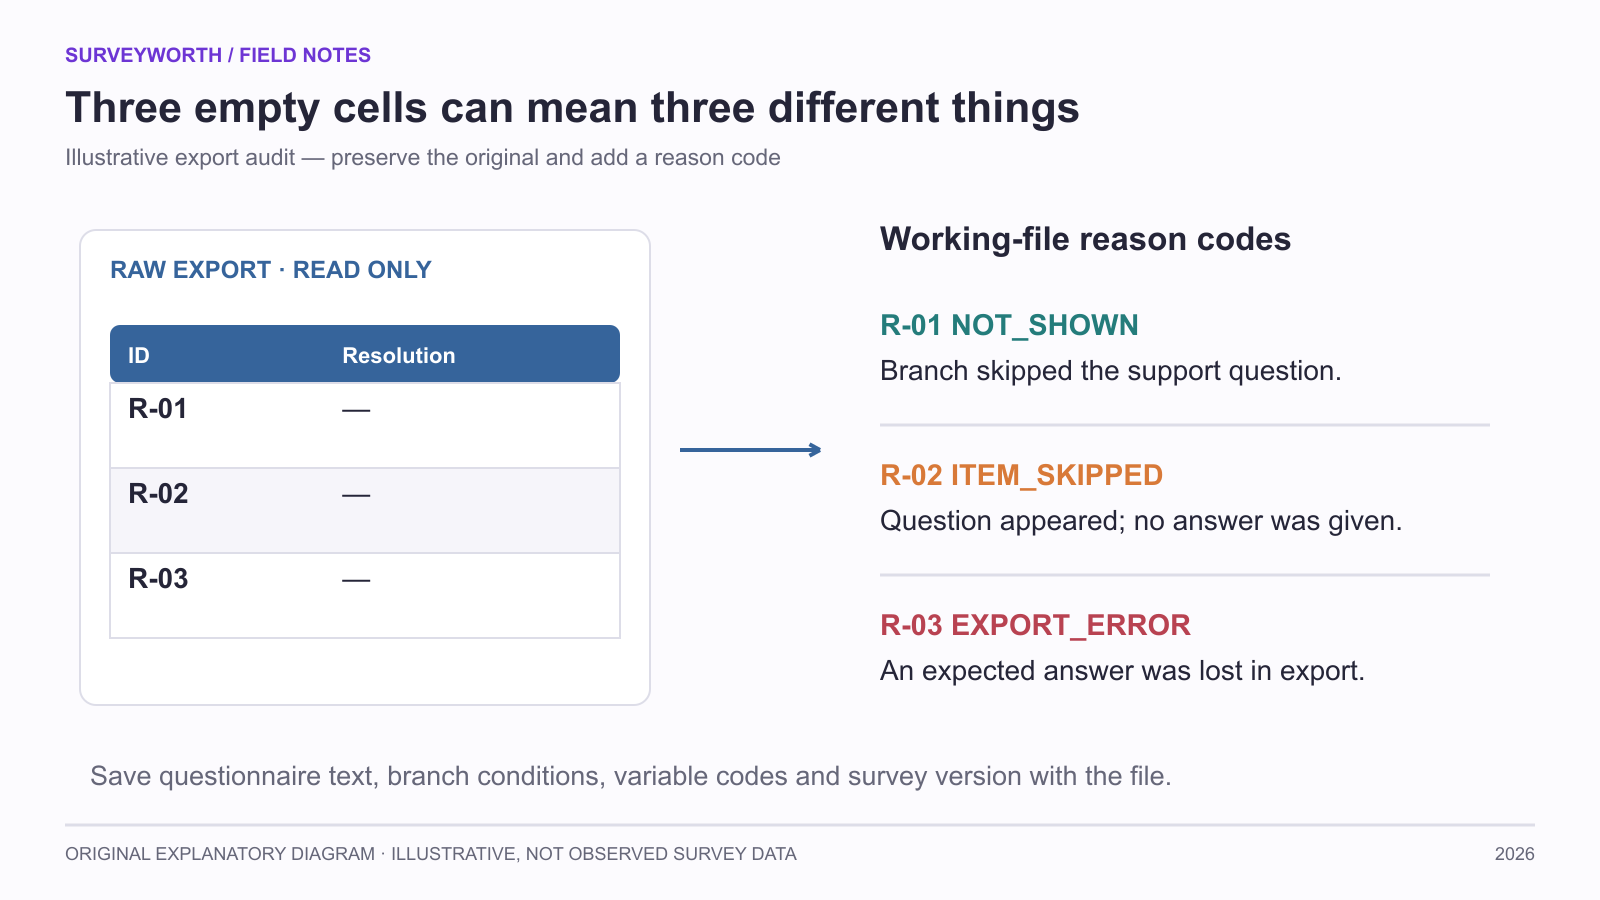
Image source: SurveyWorth original explanatory diagram, 2026. Illustrative, not observed survey data. Based on this article’s “Build a reproducible analysis file” section(s); not a product screenshot.
Apply eligibility and quality rules consistently. If you exclude a respondent because they failed a screener, record that reason. If you suspect duplicate submissions, flag them and compare the result with and without them. Surprising answers are not automatically errors. A reproducible file makes it possible for another analyst to understand how the headline number was produced.
Read distributions before averages
A mean can conceal disagreement. If half of respondents choose the lowest ease rating and half choose the highest, the average appears moderate even though almost nobody had a moderate experience. Show counts or proportions for each scale point. For a single-choice item, use the number who answered that item as the base. For a multi-select item, state whether the percentage is of respondents or of all selections.
Consider an illustrative survey with 120 eligible completions. If 90 were shown a support question because the rest never contacted support, first count how many of those 90 actually answered it. If all 90 answered and 18 reported unresolved issues, report 18/90 = 20%. If five skipped the item, the answer distribution uses 85 as its base and the five skips are reported separately. Do not silently use the total sample as denominator.
Use crosstabs with a purpose
A crosstab compares the outcome across a meaningful group: new versus returning users, device categories, or order types. Specify the comparison before looking at dozens of combinations. Check cell counts. A difference of 40% versus 20% may be fragile if it represents four versus two people. If groups were recruited through different channels, the channel may explain part of the difference.
When reporting a trend, align question wording, scale, audience, trigger, and field period. A score from a post-delivery email survey is not directly interchangeable with a score from a website popup shown at checkout.
Turn open answers into evidence
Create themes with definitions, code every response consistently, and retain a few de-identified examples. State how many people answered the open item. If a complaint appears in five comments, it may be important even if it is not the most frequent category, especially when it signals a severe failure. Severity and frequency are separate dimensions.
Write the conclusion in three layers
First, say what the data directly show. Second, explain plausible interpretations and competing explanations. Third, propose a next action or test. For example: “Among recent respondents who contacted support, unresolved cases were more common on mobile. We should inspect the mobile support flow and test a clearer escalation path.” This is more defensible than “Mobile causes unresolved cases.” Include a limitations paragraph and a responsible owner for each recommendation.
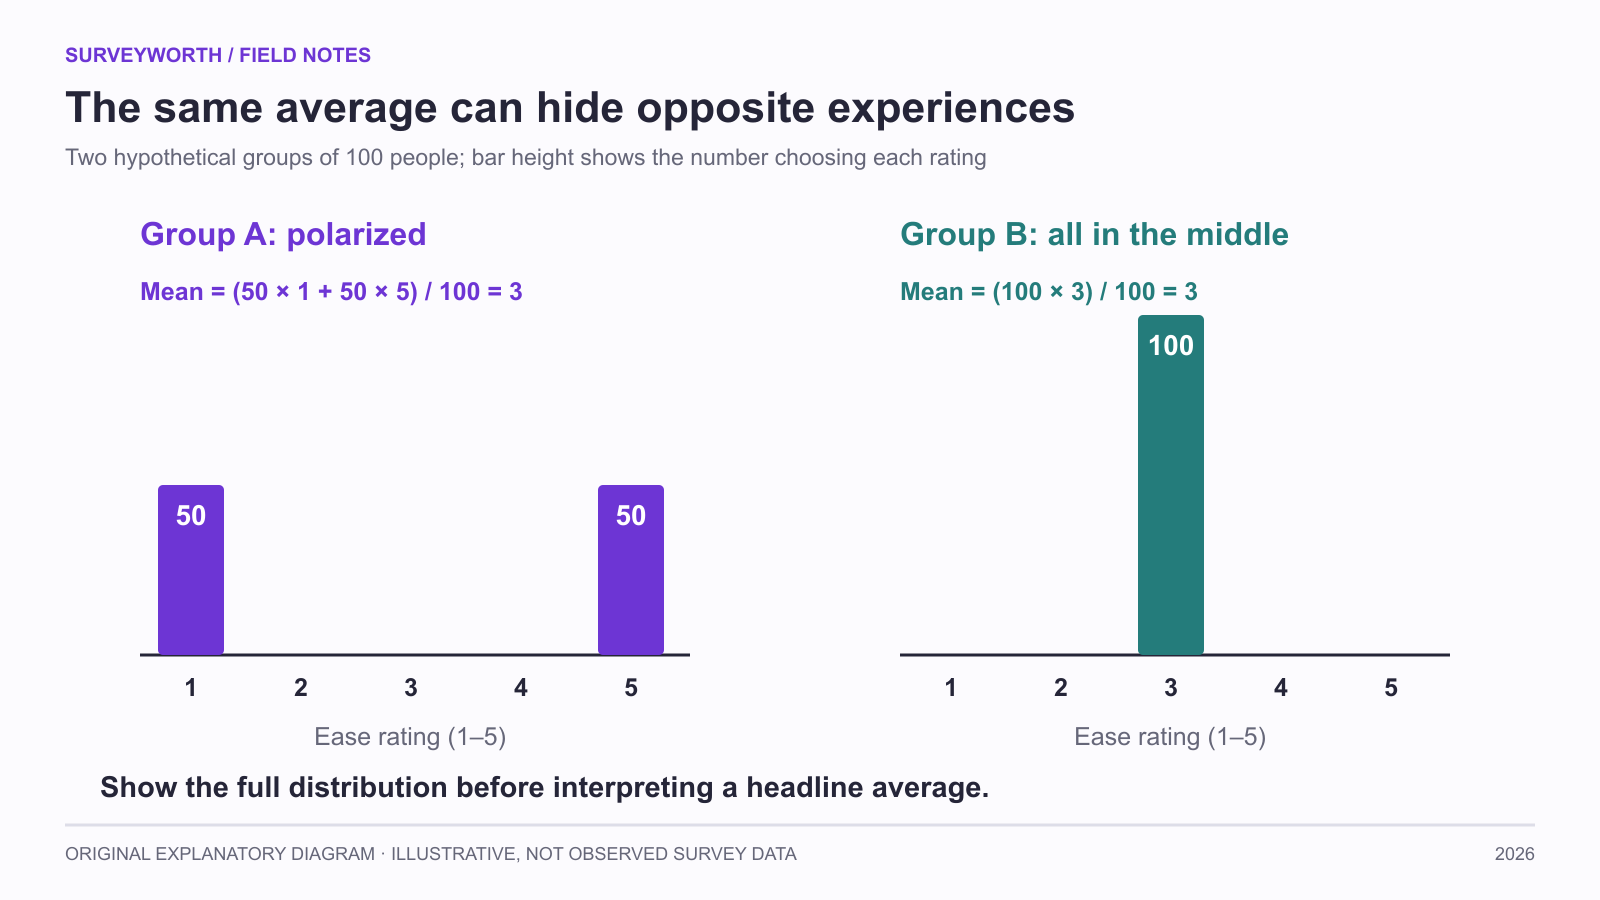
Image source: SurveyWorth original explanatory diagram, 2026. Illustrative, not observed survey data. Based on this article’s “Read distributions before averages; Use crosstabs with a purpose” section(s); not a product screenshot.
An example report paragraph
“Of the 90 respondents who had contacted support and answered the resolution item, 18 said their issue was not resolved. This group was recruited through a post-case email during the stated field period. Their comments most often mentioned repeated handoffs. Because the survey covers email-reachable customers who responded, the 20% figure should not be presented as the unresolved rate for every support case. We will audit handoff records and test a clearer escalation route.” This paragraph names the base, recruitment, finding, limit, and next action. It is more useful than a chart titled “Support satisfaction: 80%.”
For major decisions, attach a short appendix with the full questionnaire, field dates, exclusions, and analysis definitions. It lets another team check the interpretation without reading the entire raw dataset.
Mark exploratory findings
A planned comparison and an unexpected pattern found after examining many slices should not be described with the same confidence. Label exploratory findings and propose a follow-up test. Keep the chart and its base in the report, but avoid a definitive headline from a small cell. This distinction makes the analysis more useful: the team can act on a strong operational problem while learning where more evidence is needed.
Make each analysis step leave a trace
Hotjar’s six-stage analysis outline moves from the decision to cleaning, quantitative and qualitative analysis, communication, and action. Typeform’s analysis walkthrough similarly separates preparing data from interpreting it. Turn that progression into an audit trail rather than a one-time dashboard export: save raw data read-only, a cleaning log, a question-level base table, a codebook for open answers, and a dated decision memo.
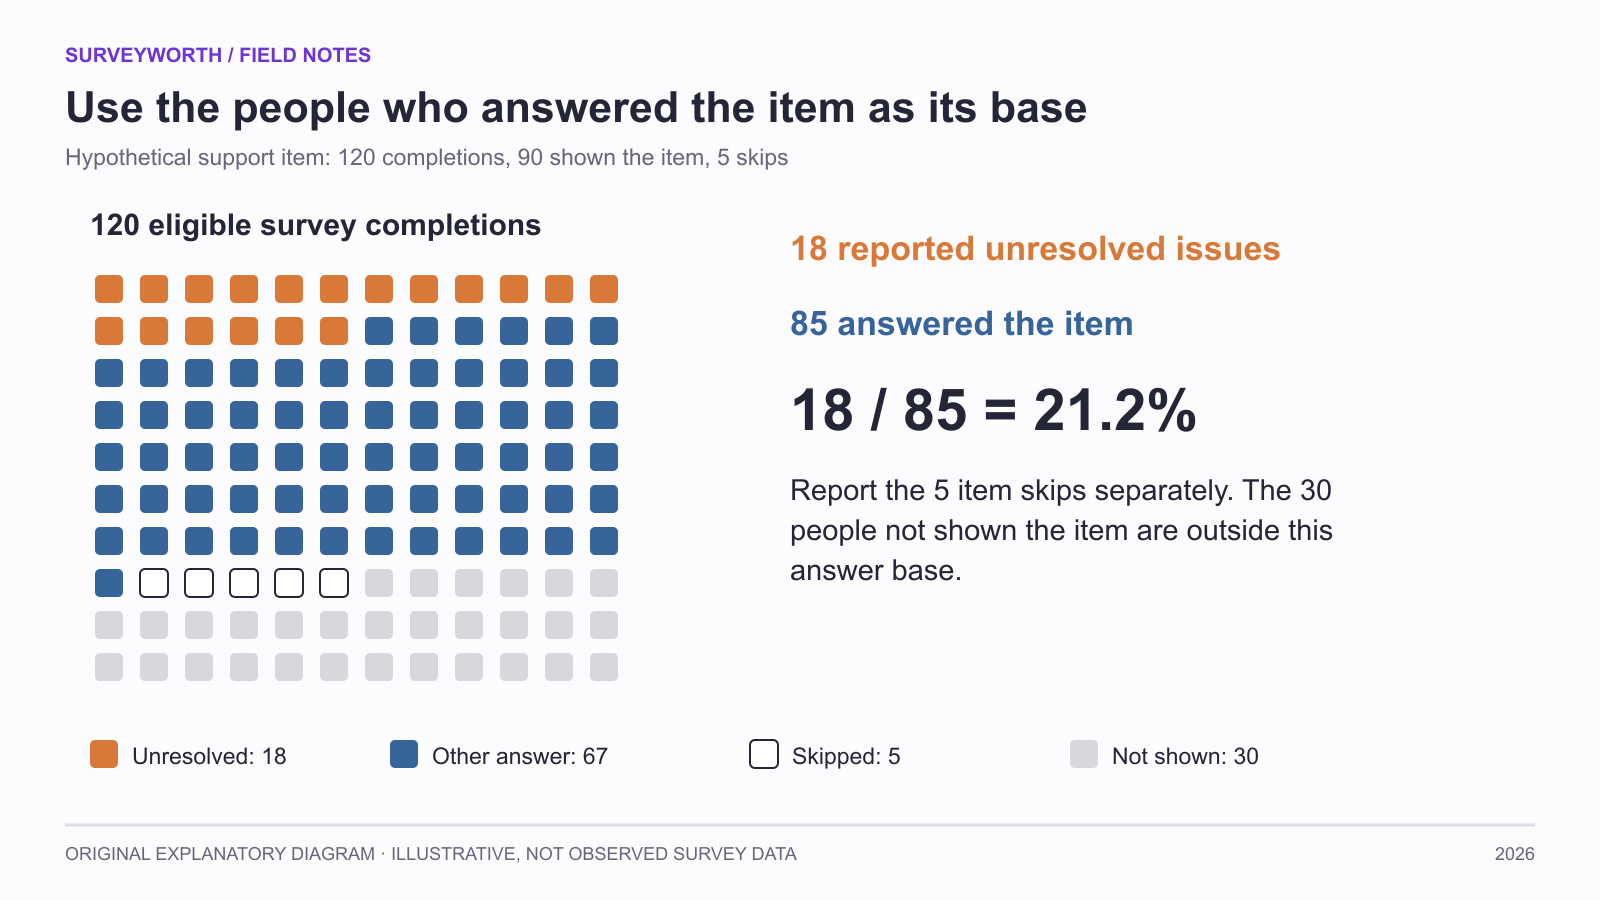
Image source: SurveyWorth original explanatory diagram, 2026. Illustrative, not observed survey data. Based on this article’s “Read distributions before averages; Make each analysis step leave a trace” section(s); not a product screenshot.
| Step | Input | Output a reviewer can inspect |
|---|---|---|
| Eligibility | Original records and study rules | Included/excluded IDs with reasons. |
| Item summary | Eligible records | Counts by answer, item skips, and base. |
| Open coding | Raw comments | Codebook, disagreements, and theme counts. |
| Interpretation | Tables and comments | Claim, alternative explanation, next test. |
For example, “mobile users were less likely to report resolution” is descriptive if the groups were reached through different channels. Check whether issue type or invitation timing differs before choosing a fix. Typeform’s data-analysis practices are a useful reminder to connect quantitative patterns with respondent language, while the open-answer coding guide explains how to preserve negative cases. The analyst should be able to reproduce each percentage from the saved base table.
Choose tools for your next survey.
Explore survey creation software and research tools for your project.
Explore survey softwareKeep reading.

How to Test a Marketing Campaign With Surveys
Use surveys before, during, and after a campaign to test message clarity and track audience response without overclaiming causality.
Read the guide
How to Measure Brand Awareness With a Survey
Measure unaided recall and aided recognition with balanced survey questions and careful sampling.
Read the guide
How to Design a Product Testing Survey
Write product concept, prototype, and post-launch survey questions that fit what participants have actually experienced.
Read the guide