
How to Create a Customer Satisfaction Survey
Build a customer satisfaction survey with clear timing, targeted questions, and an action plan for the results.

A customer satisfaction survey measures how customers evaluate a defined experience. The word “defined” matters: satisfaction with a support case is different from satisfaction with a brand overall. Decide which experience you want to improve before choosing questions.
Two CSAT instruments for different decisions
After a support case closes: (1) “Was your issue resolved?” — Yes / Partly / No; (2) “Overall, how satisfied were you with this support interaction?” — Very dissatisfied to Very satisfied, five labeled choices; (3) optional “What should we improve?” This measures one service event. Report satisfaction among those who answered item 2, and resolution separately.
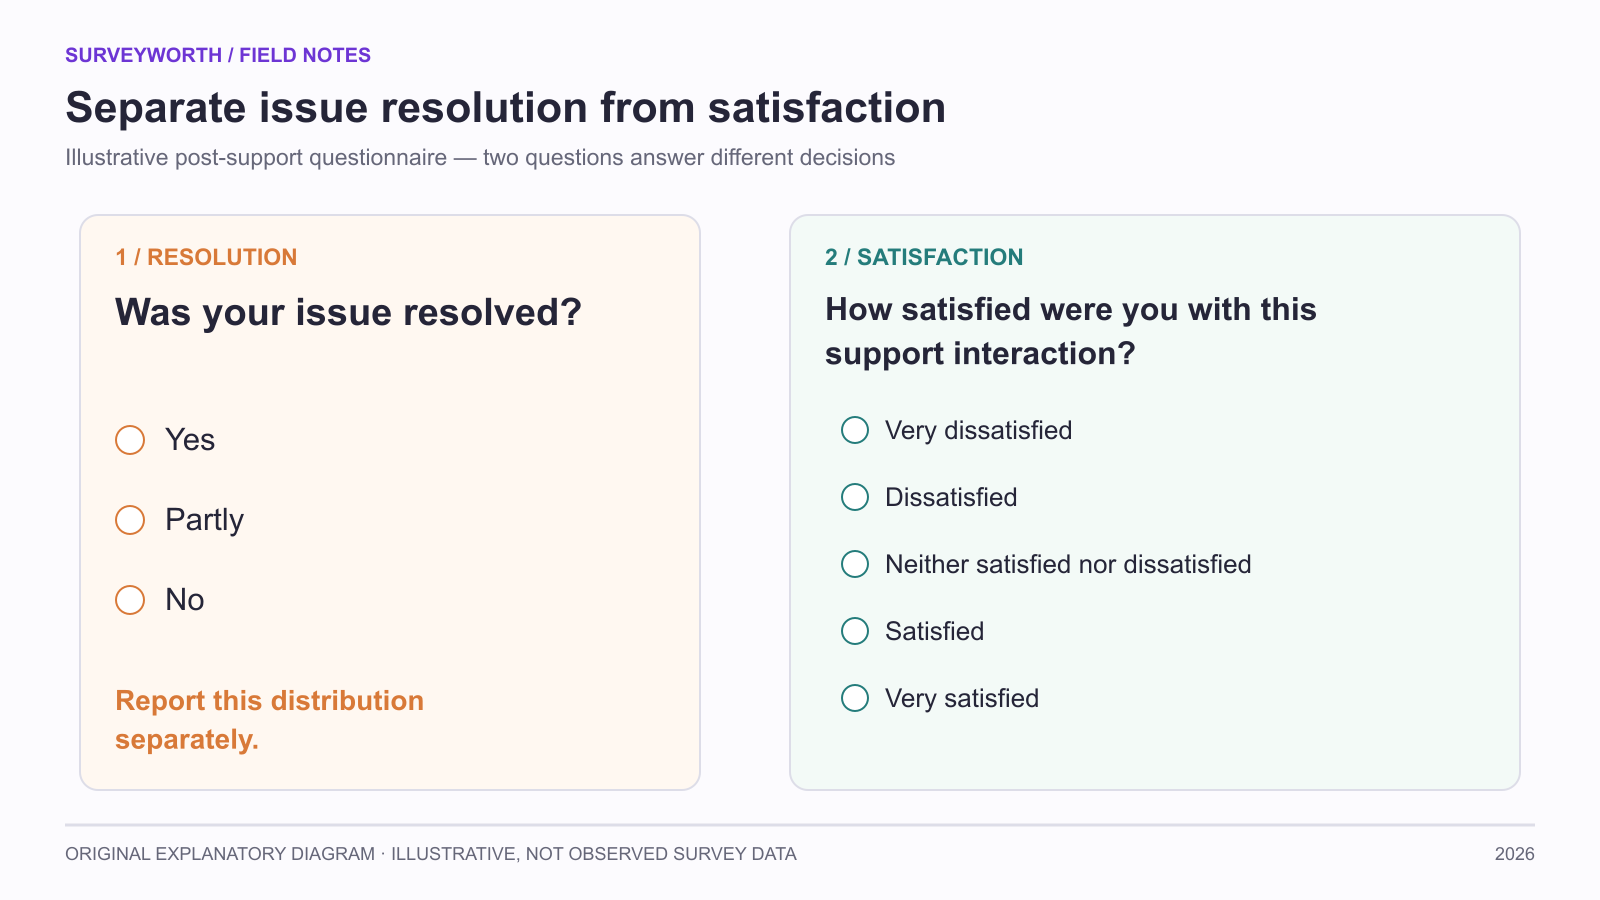
Image source: SurveyWorth original explanatory diagram, 2026. Illustrative, not observed survey data. Based on this article’s “Two CSAT instruments for different decisions; Decide what “satisfied” refers to” section(s); not a product screenshot.
After a delivery: (1) “Was the order delivered when you expected?” — Earlier / On time / Later / Not sure; (2) “How satisfied were you with the delivery experience?” — the same five labeled satisfaction choices; (3) optional “What was the main reason for your rating?” This measures delivery, not the whole brand or the product itself.
Suppose 80 of 100 support respondents select Satisfied or Very satisfied, while 65 of 100 delivery respondents do so. Those are separate descriptive shares with different events and possibly different samples; do not call the combined 72.5% a company-wide CSAT. Save the question wording, invitation timing, sampling route, and base with each chart. If a team changes the scale or event definition, mark the trend break.
Decide what “satisfied” refers to
Satisfaction can describe a support interaction, an order, a product, or the whole relationship. A customer may be satisfied with a friendly agent while dissatisfied with the unresolved problem. Name the object in the question and keep the trigger close to that experience. If you want to compare scores over time, preserve the same object, wording, scale, and timing.
For a support case, an invitation after closure can ask whether the issue was resolved and how satisfied the customer was with the interaction. For a product, wait until meaningful use is possible. Sending a product-quality question immediately after checkout asks for a prediction, not an evaluation.
Analyze beyond one headline score
Report the full distribution, the number who answered each item, and the share who selected “Not applicable” or skipped. A flat average can hide a group with a very poor experience. Compare preplanned segments such as first-time versus repeat customers only when each base is adequate and recruitment was comparable. Read open comments from both high and low scores; satisfied customers can identify what must be preserved, while dissatisfied customers can explain what failed.
For an illustrative result, suppose 120 recent support users answer: 80 report resolution, 25 partial resolution, and 15 no resolution. A satisfaction percentage alone might look acceptable, but the unresolved group is an operational issue. The team should inspect cases and test whether a routing or knowledge-base change reduces unresolved contacts. The survey points to the issue; case review and testing identify the fix.
Close the loop without overclaiming
Make a short action record: finding, evidence, owner, next change, and review date. If customers gave identifiable feedback and opted into contact, respond appropriately. For aggregate feedback, communicate the improvement publicly when possible. On the next survey wave, check whether the same measure changed under a comparable method. A score shift is a signal, not proof that a single change caused it.
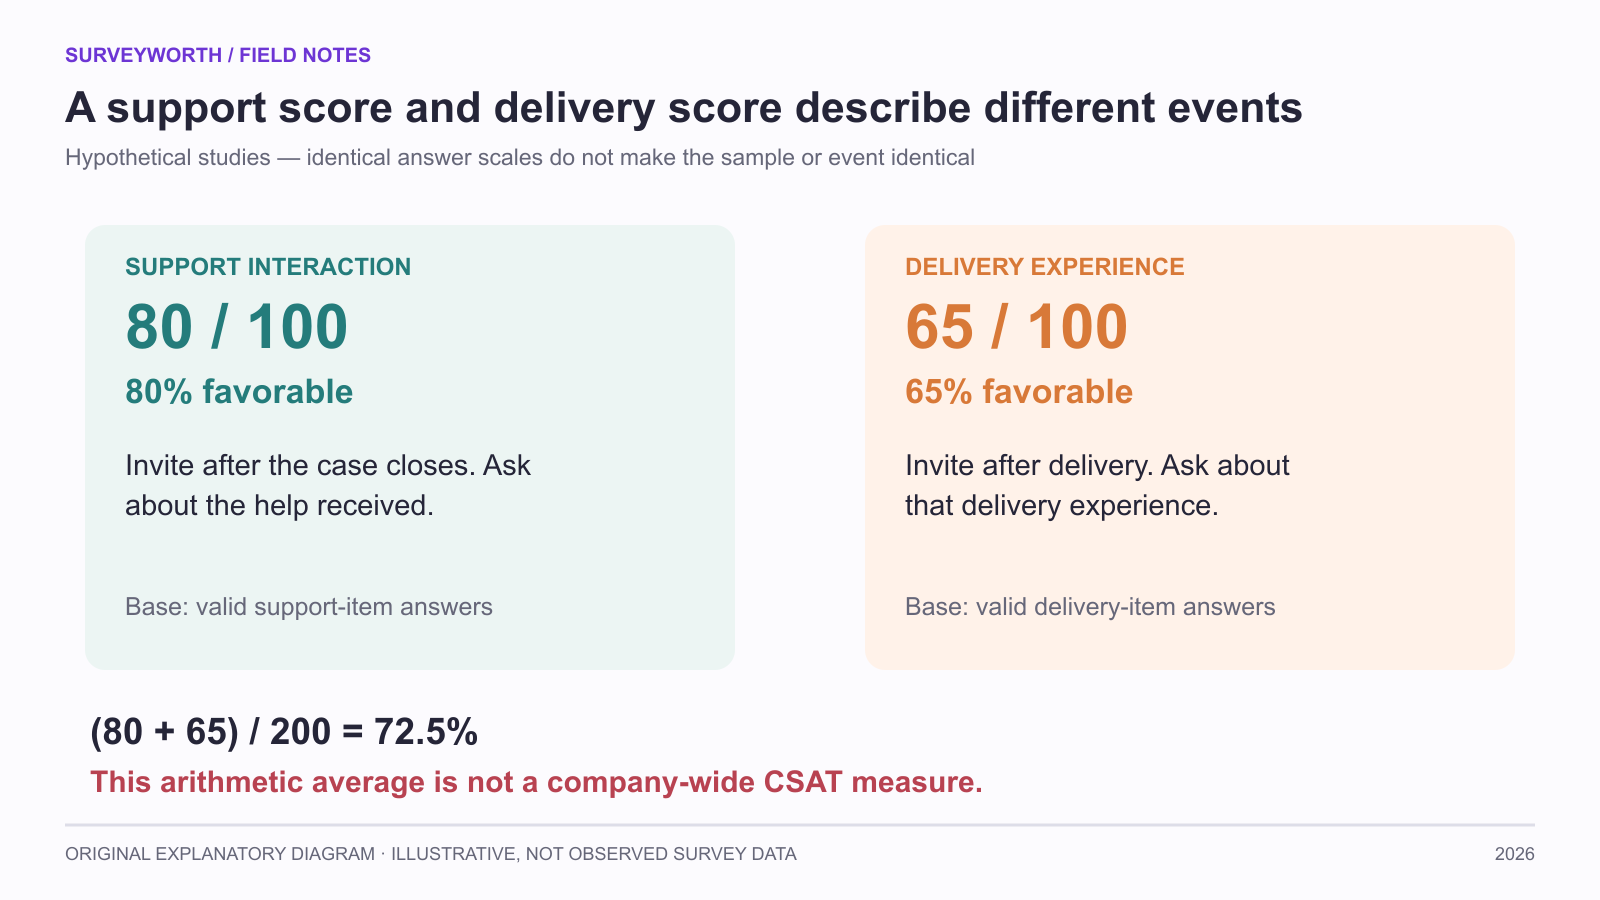
Image source: SurveyWorth original explanatory diagram, 2026. Illustrative, not observed survey data. Based on this article’s “Two CSAT instruments for different decisions; Protect trend comparability” section(s); not a product screenshot.
Protect trend comparability
Keep a change log for the survey instrument and operational context. A new support channel, altered case-closure rule, or changed invitation timing can shift the satisfaction distribution even if the underlying service quality is unchanged. Annotate dashboards with these events. When the method changes substantially, create a new baseline rather than presenting a continuous line without explanation.
Build the question from the transaction, then calculate
Suppose the team needs to know whether a support case was handled well. Ask about that case soon after it closes, show a fully labeled scale, and provide “I did not contact support” only if the invitation route could reach nonusers. Involve.me’s satisfaction-survey guidance emphasizes short, contextual questions, and Typeform’s customer-satisfaction examples show how the moment of collection changes what a respondent can assess. A shipping satisfaction item sent before delivery is a different and invalid request.
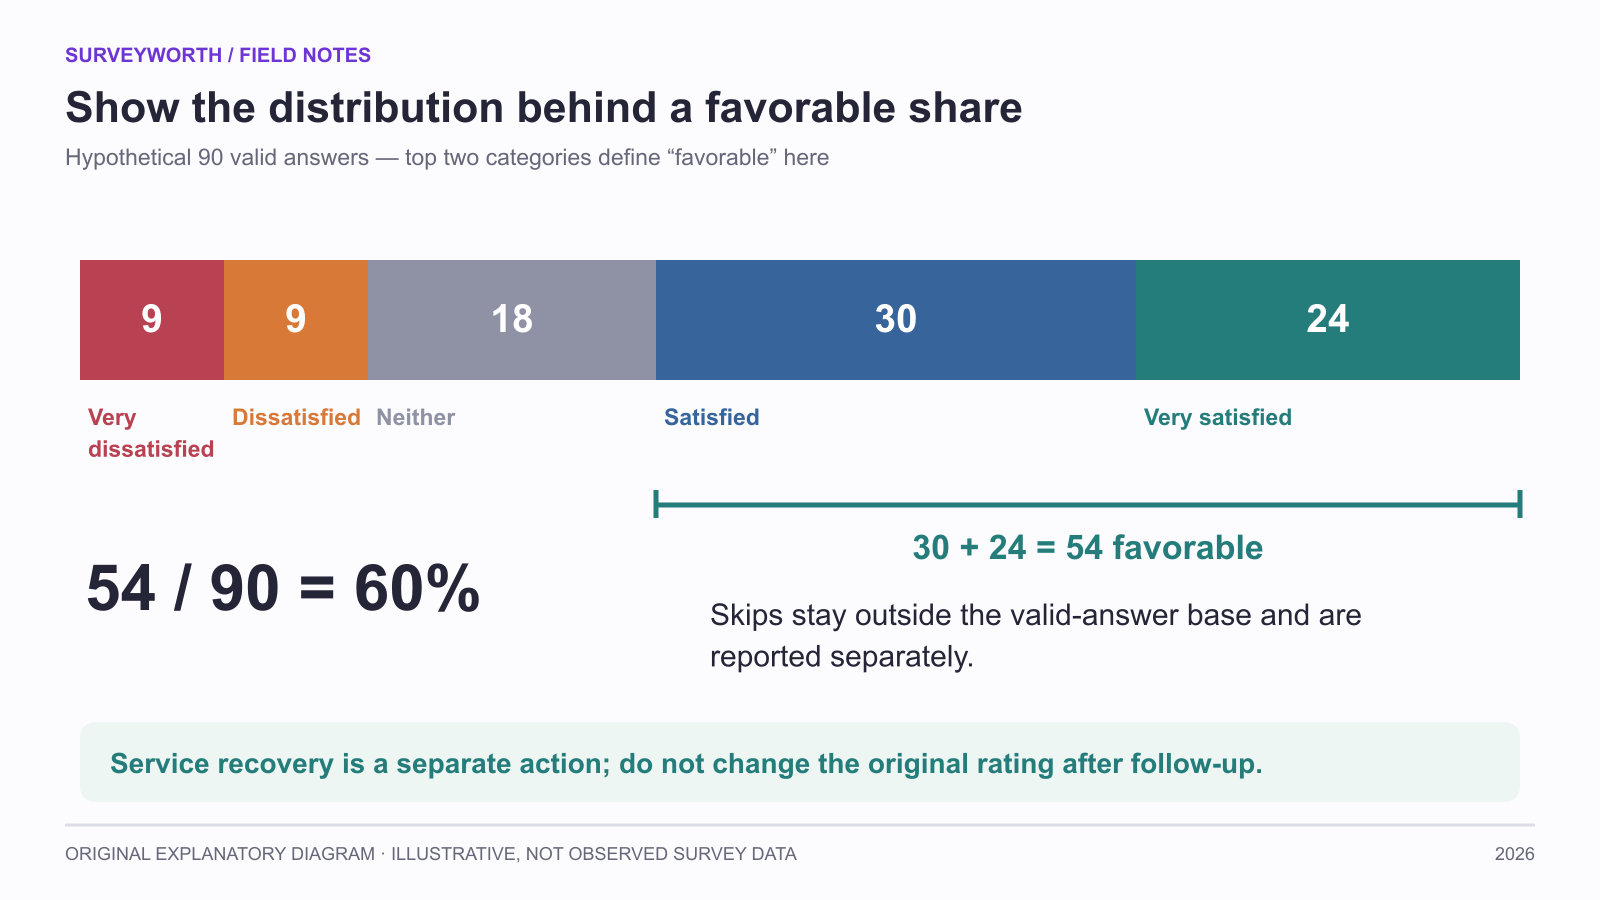
Image source: SurveyWorth original explanatory diagram, 2026. Illustrative, not observed survey data. Based on this article’s “Build the question from the transaction, then calculate; Keep service recovery separate from measurement” section(s); not a product screenshot.
| Field | Record before launch | Why it matters |
|---|---|---|
| Event | Support case closed | Defines who had the experience. |
| Item | “How satisfied were you with the help you received?” | Defines the object rated. |
| Scale | Very dissatisfied to Very satisfied | Prevents an ambiguous numerator. |
| Base | Valid answers to this item | Keeps skips out of the percentage. |
For a hypothetical 90 valid answers, if 54 select either top-two category, the locally defined favorable share is 54/90 = 60%. Publish the entire five-category distribution too; two teams could each report 60% favorable with very different numbers of strongly negative answers. Customer-service question examples can help design a follow-up about resolution, but do not combine courtesy and resolution into one score. The metric comparison helps when the decision calls for effort or relationship measures instead.
Keep service recovery separate from measurement
A negative support rating may identify someone who needs help now. Provide a visible support route and, when follow-up is permitted, ask separately whether they want contact. Do not condition service on answering more research questions. Involve.me’s customer-feedback discussion frames collection as a step toward action, while Formstack’s customer-satisfaction question examples illustrate how a narrow item can focus on a specific event. Log the service ticket and survey record under the actual privacy policy; a rating spreadsheet should not become an unmonitored support queue. Report how many dissatisfied respondents requested follow-up and how many cases were resolved, without changing the original CSAT denominator.
Frequently asked questions
Is customer satisfaction the same as loyalty?
No. A satisfied customer may still choose another provider. Satisfaction is an evaluation of an experience, not a complete measure of future behavior.
Should I survey every customer?
That depends on contact volume, fatigue, and the research goal. A planned sample can reduce repeated requests while still supporting the decision.
Choose tools for your next survey.
Explore survey creation software and research tools for your project.
Explore survey softwareKeep reading.

How to Test a Marketing Campaign With Surveys
Use surveys before, during, and after a campaign to test message clarity and track audience response without overclaiming causality.
Read the guide
How to Measure Brand Awareness With a Survey
Measure unaided recall and aided recognition with balanced survey questions and careful sampling.
Read the guide
How to Design a Product Testing Survey
Write product concept, prototype, and post-launch survey questions that fit what participants have actually experienced.
Read the guide