
CSAT vs. NPS vs. CES: Which Customer Experience Metric Should You Use?
Compare CSAT, NPS, and Customer Effort Score by the decision each supports and the limits of each metric.

CSAT, NPS, and CES answer different questions. Choose the metric based on the experience you can change, then add a short explanation question. A score without context rarely identifies the fix.
Match the question to the decision owner
A support manager who wants to reduce friction may prefer an effort measure: “How easy was it to get your issue resolved?” A delivery manager may need a satisfaction item about the delivery experience. A brand team may track recommendation intent over time. The best primary metric is the one that points to a decision the owner can make, not the one with the most familiar acronym.
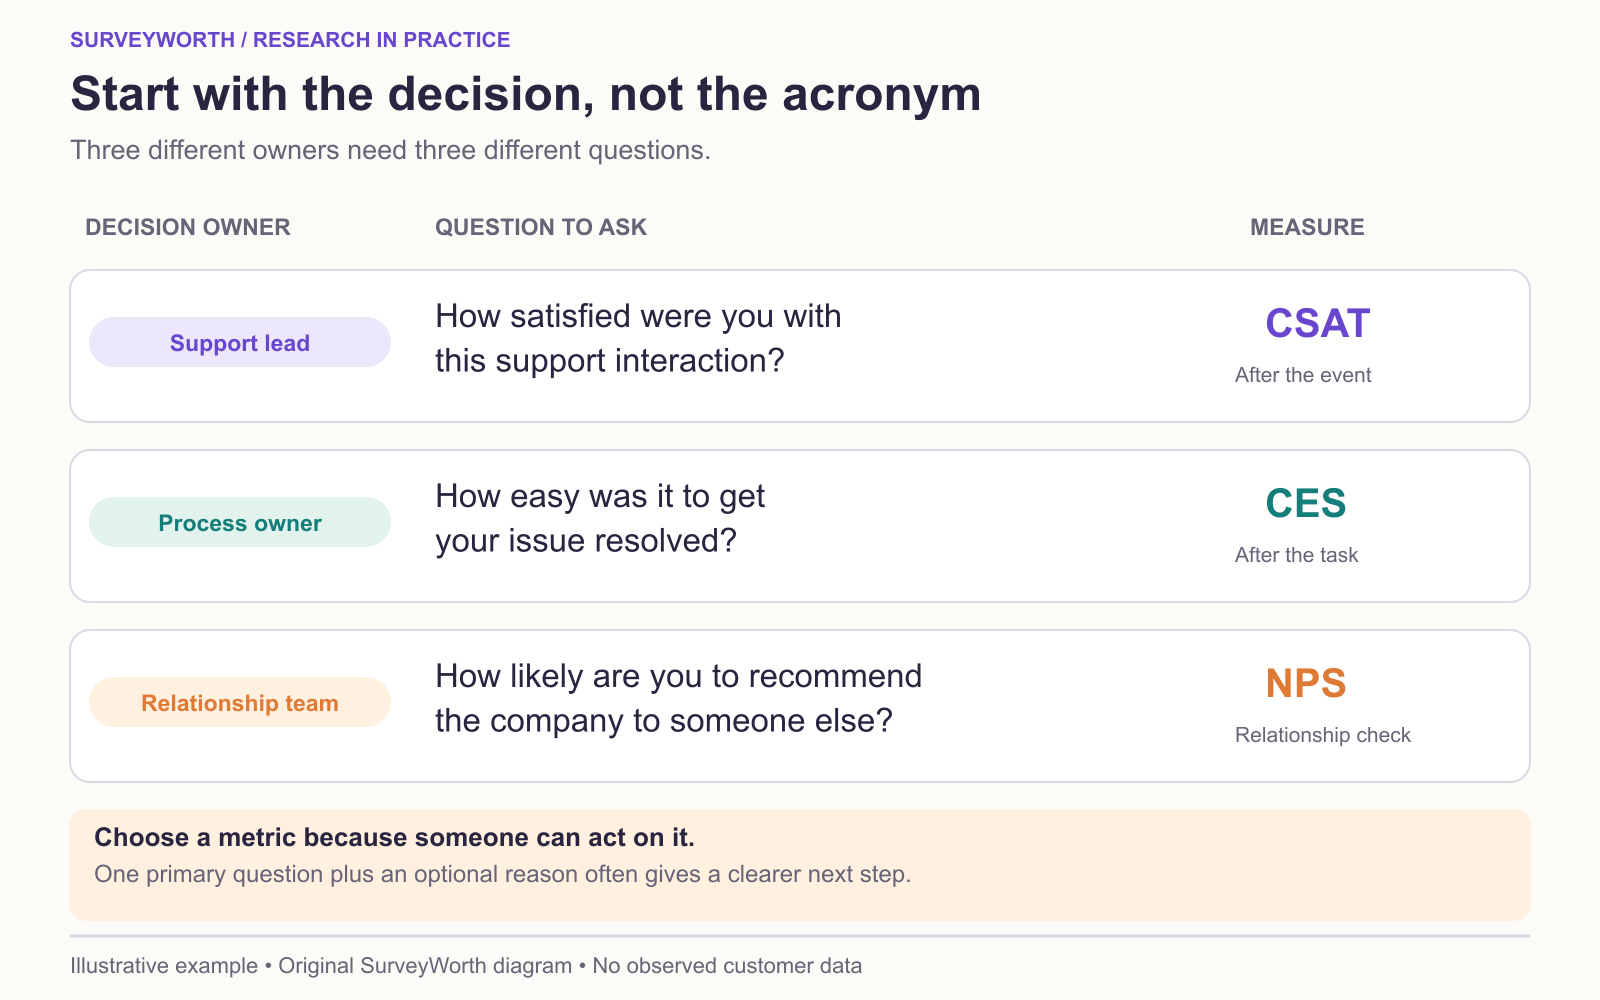
Image source: SurveyWorth original conceptual diagram, 2026. Based on “Match the question to the decision owner” in this guide. Illustrative example; no observed survey data or official product screenshot.
CSAT often summarizes the share of respondents choosing favorable satisfaction options, but organizations define those options differently. A five-point scale and a seven-point scale cannot be compared as raw percentages without explaining the top-box rule. CES measures perceived effort, yet versions differ in wording and direction; one form asks ease, another asks effort. Qualtrics’ CES explainer describes the measure, but the 60% “easy” share below is this article’s stated top-two-box convention, not a universal CES formula. Store exact wording and labels. NPS uses the 0–10 recommendation question and the promoter-minus-detractor formula. Keep these definitions visible in any dashboard.
Keep the questionnaire lean
Ask one primary measure at the relevant moment, then one optional reason prompt. If a team needs two measures for a specific analysis, explain why both are necessary and check whether the added burden changes completion. Do not put CSAT, CES, and NPS after every interaction by default. That can irritate customers and produce repetitive answers.
Create a metric specification with question text, scale, collection trigger, eligible audience, reporting formula, denominator, and owner. This prevents different departments from publishing different “CSAT” numbers that appear comparable but are not.
Interpret improvement carefully
A rising score is encouraging only if the survey method and respondent mix are stable. A change in who is invited or when they answer can move a metric. Inspect the distribution, reasons, and operational data. If high effort remains concentrated among complex cases, compare like with like before concluding the support process has worsened. Treat each measure as evidence for an action, not as a grade to optimize in isolation.
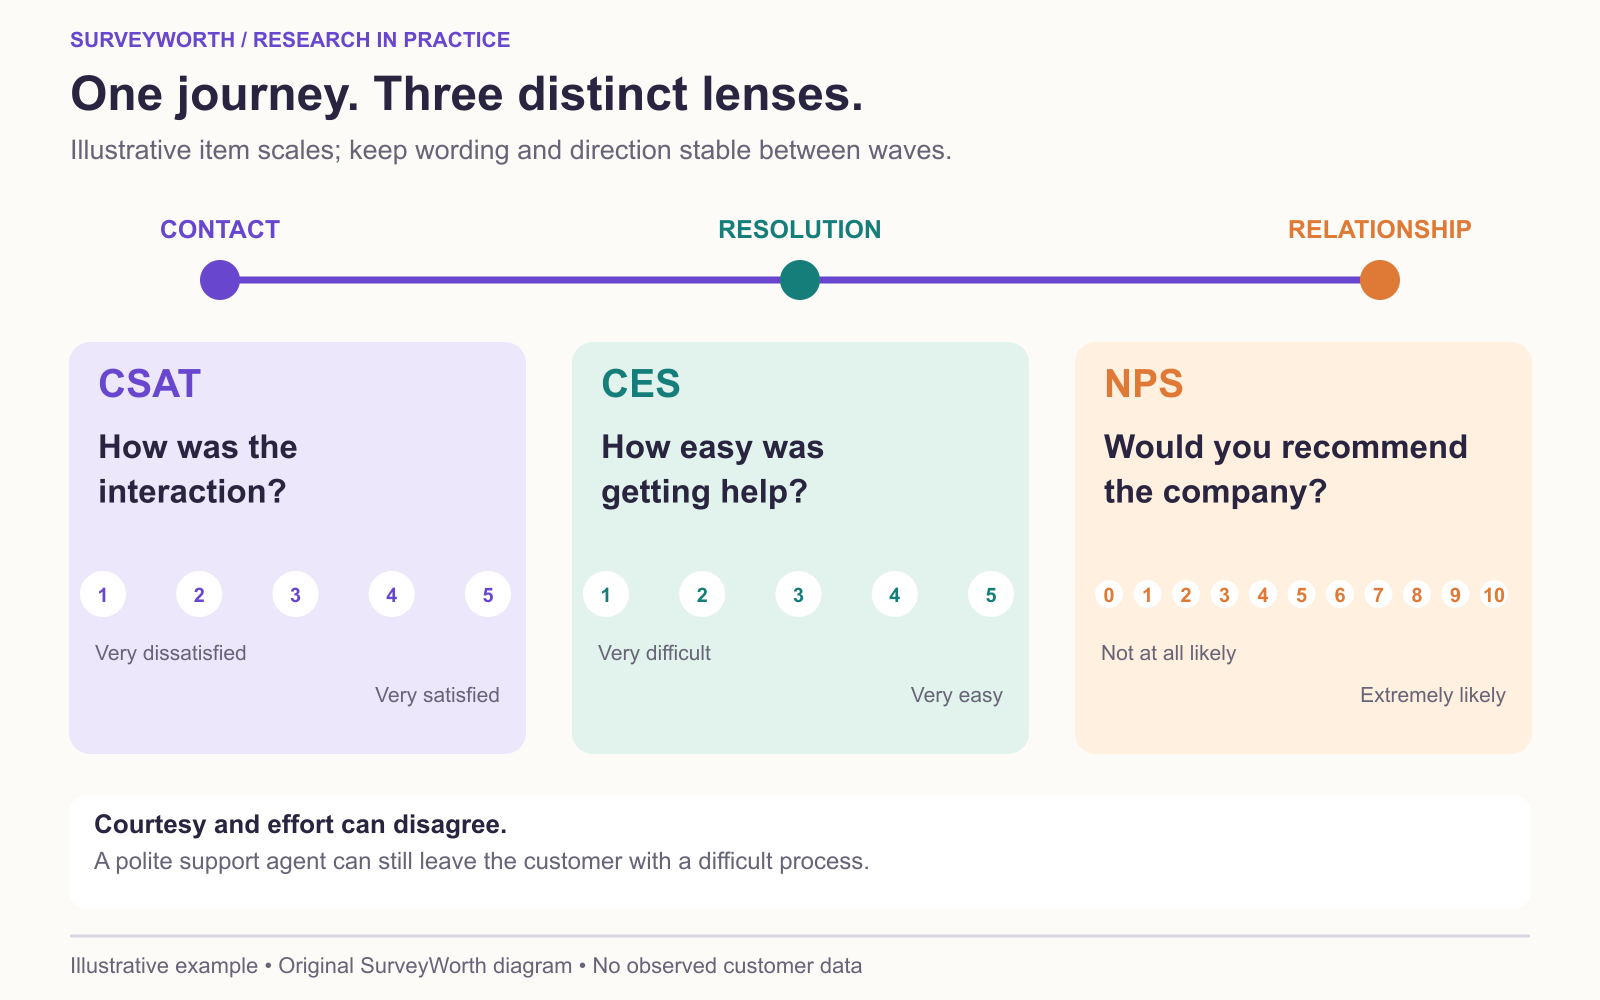
Image source: SurveyWorth original conceptual diagram, 2026. Based on “Put all three measures on one service journey” in this guide. Illustrative example; no observed survey data or official product screenshot.
Put all three measures on one service journey
Suppose a U.S. customer tried to replace a damaged item. A post-contact CSAT item can ask satisfaction with the support interaction; a CES item can ask how easy it was to resolve the issue; a relationship NPS item can ask likelihood to recommend the company. Jotform’s CES question examples show task-specific wording, while QuestionPro’s NPS explanation uses the familiar 0–10 recommendation scale. The customer-service question bank from Involve.me offers prompts for locating the actual service failure. These are different constructs, so a high courtesy rating alongside high effort is not contradictory.
Record one item specification per metric: object rated, trigger, scale labels, eligible group, and calculation. If 80 of 100 support respondents answer the CES item, the CES distribution is based on 80 valid answers; report the 20 missing answers separately. A local “percent easy” metric must state which options count as easy. The Qualtrics CES overview shows why ease can be reported with different scale conventions; preserve the exact question when comparing waves. If the team’s decision is about a checkout step rather than service, see the website-feedback guide for a task-specific prompt.
Avoid a misleading combined dashboard
If 80 people answer a support CSAT item, 70 answer a CES item, and 300 answer a relationship NPS item, the three percentages describe different answer bases and may describe different populations. Put the exact item and field timing next to each chart. Bain’s NPS explanation gives the standard promoter and detractor classification; Typeform’s satisfaction-survey examples show task-specific CSAT questions. A report can compare directions over time but should not average the scores or treat a change in one as confirmation of another. If effort improves after a new help article, check actual task completion before crediting the article for a retention change.
Calculate all three in one fictional support setting
Suppose a support team surveys 100 eligible customers whose support cases have closed, and each metric has 80 valid answers. For CSAT, 56 of 80 choose Satisfied or Very satisfied on a five-point interaction-satisfaction scale, giving 70% under that stated top-two-box definition. For CES, 48 of 80 choose Easy or Very easy on a five-point ease scale for getting help, giving 60% under that stated top-two-box definition. For NPS, 32 of 80 score 9–10, 24 score 7–8, and 24 score 0–6 on a company recommendation item, giving 40% promoters minus 30% detractors = +10.
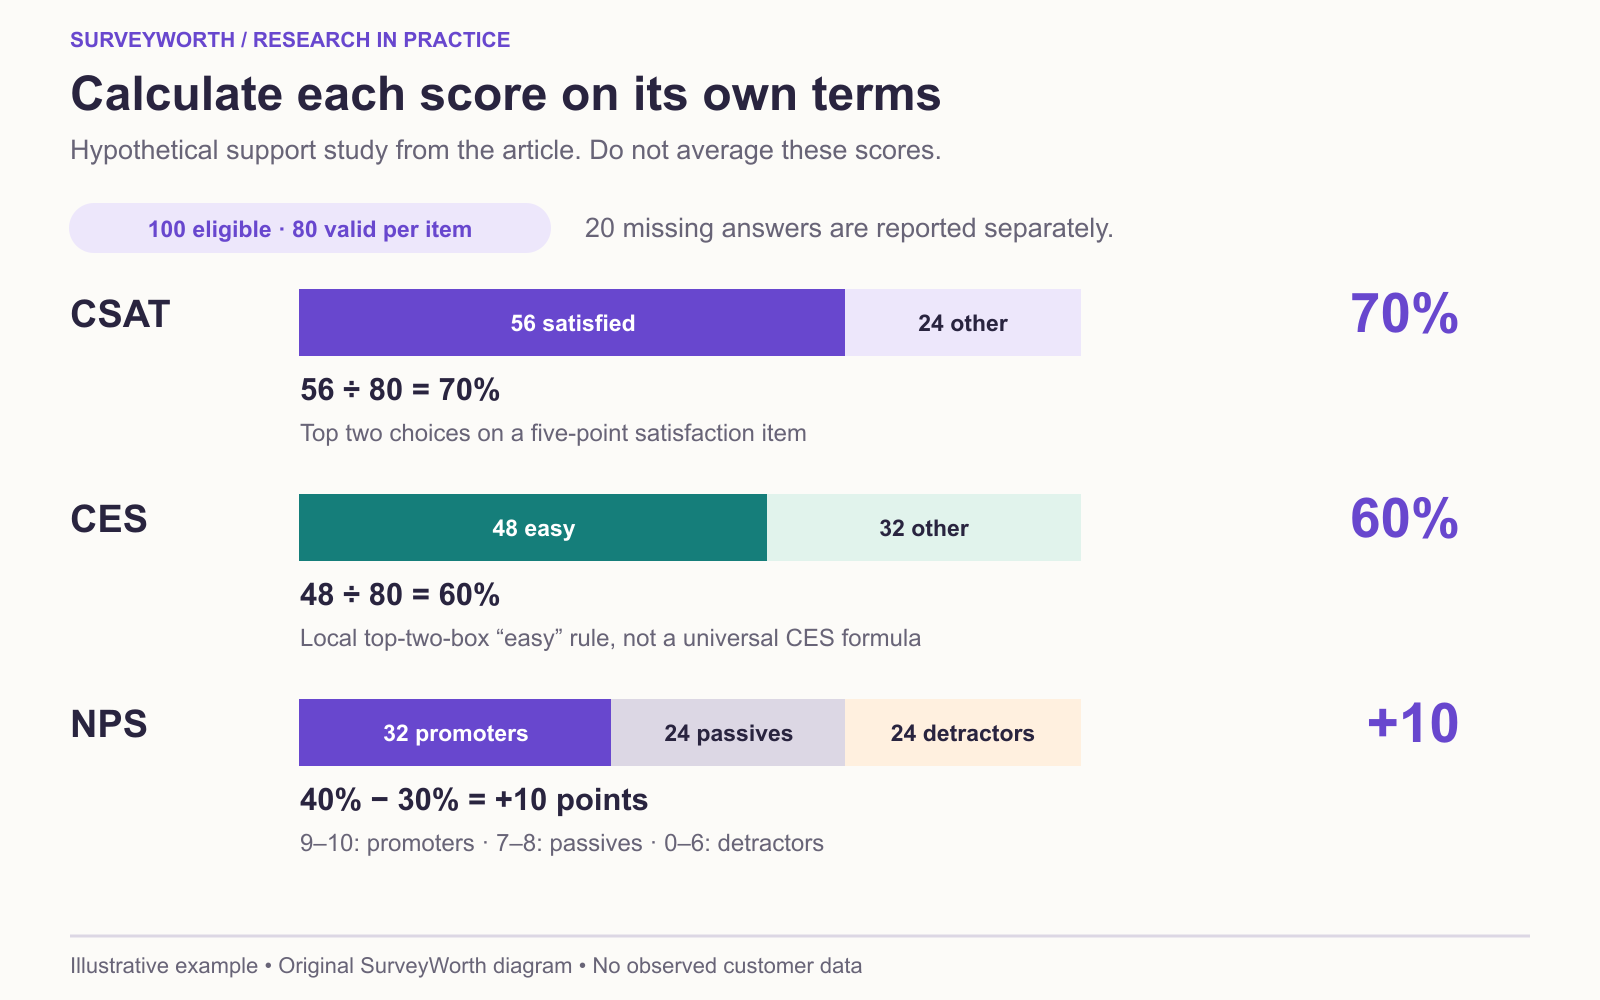
Image source: SurveyWorth original conceptual diagram, 2026. Based on “Calculate all three in one fictional support setting” in this guide. Illustrative example; no observed survey data or official product screenshot.
These are hypothetical numbers. The three values do not form a ranking: satisfaction percentages, ease percentages, and NPS points measure different things and use different scoring rules, even when their valid-answer bases are the same. A team fixing a difficult support process can track CES and observed task completion; a service owner may use CSAT after cases; a company may monitor NPS as a broader signal. Show the exact questions and scoring rules beside the chart. If a respondent skips one metric, each item's base may differ; do not copy a single sample size onto all three.
Frequently asked questions
Which metric predicts retention best?
That varies by product, audience, and measurement. Test whether the metric relates to actual retention in your own data before making a predictive claim.
Can I change scales later?
Yes, but treat it as a new series or document a careful bridge. A raw score before and after a scale change is not directly comparable.
Can I average these three scores?
No. They measure satisfaction, recommendation intent, and effort on different scales. Report each with its own wording, denominator, and decision use.
Choose tools for your next survey.
Explore survey creation software and research tools for your project.
Explore survey softwareKeep reading.

How to Test a Marketing Campaign With Surveys
Use surveys before, during, and after a campaign to test message clarity and track audience response without overclaiming causality.
Read the guide
How to Measure Brand Awareness With a Survey
Measure unaided recall and aided recognition with balanced survey questions and careful sampling.
Read the guide
How to Design a Product Testing Survey
Write product concept, prototype, and post-launch survey questions that fit what participants have actually experienced.
Read the guide