
How to Improve Survey Response Rates Without Biasing Answers
Improve survey participation with a credible invitation, appropriate timing, lower effort, and a clear follow-up plan.

A response rate compares completed or sufficiently answered surveys with an explicitly defined set of sampled or invited people. Eligibility may be unknown for nonrespondents, so state how the denominator was constructed. Improving it can reduce the risk that only the most motivated people answer, but a higher rate alone does not guarantee an unbiased sample.
Define the metric before trying to raise it
“Response rate” can mean different things if teams use different denominators. For an email survey, distinguish delivered invitations, people who opened, people who started, people known to be eligible, and people who completed. Do not assume nonrespondents were all eligible. A completion rate among starters answers a different question from a response rate among invited people. Document which count you use. If you shared a public link and do not know how many people saw it, avoid reporting a conventional response rate.
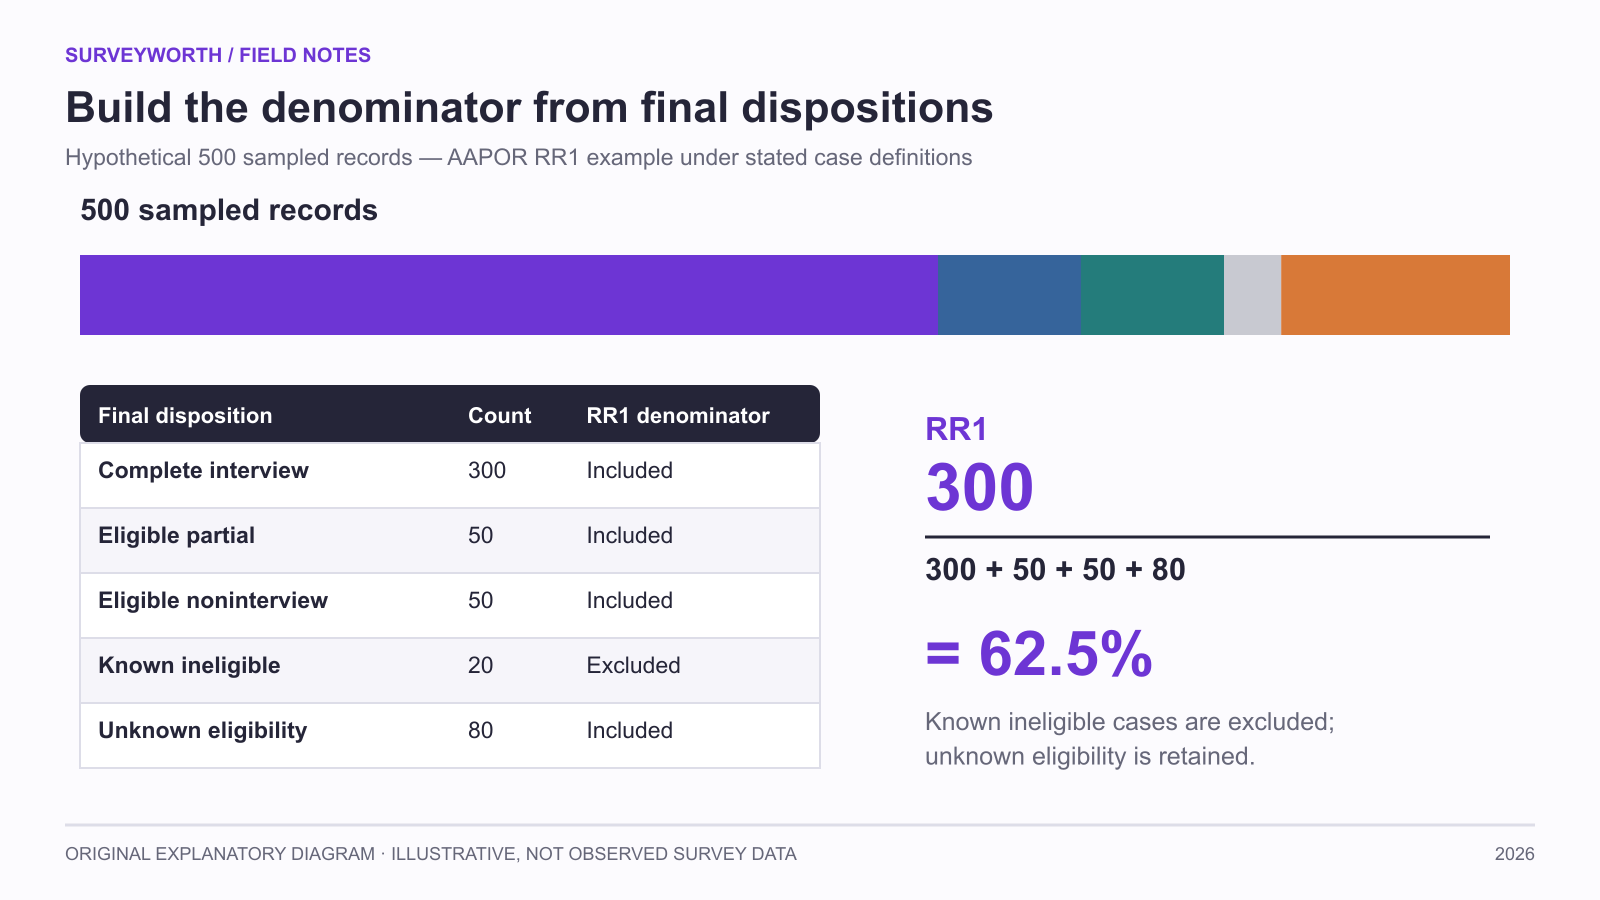
Image source: SurveyWorth original explanatory diagram, 2026. Illustrative, not observed survey data. Based on this article’s “Define the metric before trying to raise it; State the response-rate definition before reporting it” section(s); not a product screenshot.
A higher number is useful only if it comes from the right people and produces usable answers. A sweepstakes may increase starts but attract people outside the target group. Repeated reminders can overrepresent the most reachable respondents. Check respondent mix and item quality alongside the rate.
Improve the invitation in three passes
First, make the request recognizable: identify the organization actually commissioning the study, the relevant experience, and the purpose. Second, state the actual time from pilot testing, any incentive terms, and how answers will be handled. Third, make the next action obvious with one direct link. A subject line such as “Tell us about your recent support request” is clearer than “Important opportunity!” when the survey is about support.
Test the invitation with someone who did not write it. Ask what they expect to happen after clicking, whether they trust the sender, and whether the promised time feels believable. The survey landing page should match the invitation. A mismatch between a “two-minute checkout survey” email and a broad ten-minute brand study undermines trust.
Use timing and reminders responsibly
Ask after the relevant event while memory is fresh, but allow enough time for the outcome being rated. A delivery survey sent before arrival is mistimed. A support-resolution survey sent while a ticket is open asks people to judge an unfinished experience. For recurring surveys, set a contact limit so the same customer is not asked after every interaction.
A reminder can be useful when it is targeted to people who have not completed and when contact is appropriate. Keep it brief, make it easy to decline, and stop after a modest number of attempts. If the form is anonymous, examine whether the reminder system can know completion status without linking identities to responses. Do not promise anonymity and then use a hidden identifier to track individual answers.
A practical invitation rewrite
Weak: “We need your feedback! Take our important survey now and win a prize.” It says little about the experience, duration, or eligibility. Stronger: “You recently contacted support. Would you share how that interaction went? The tested completion time is [insert measured pilot time]. Your answers will help us prioritize support improvements. Participation is optional.” If an incentive exists, add its exact terms in a separate clear sentence. This is an illustrative invitation, not a verified claim about a live survey. Replace the timing placeholder and any incentive terms with measured, accurate details before sending. The stronger invitation makes a concrete request without promising a result that has not happened.
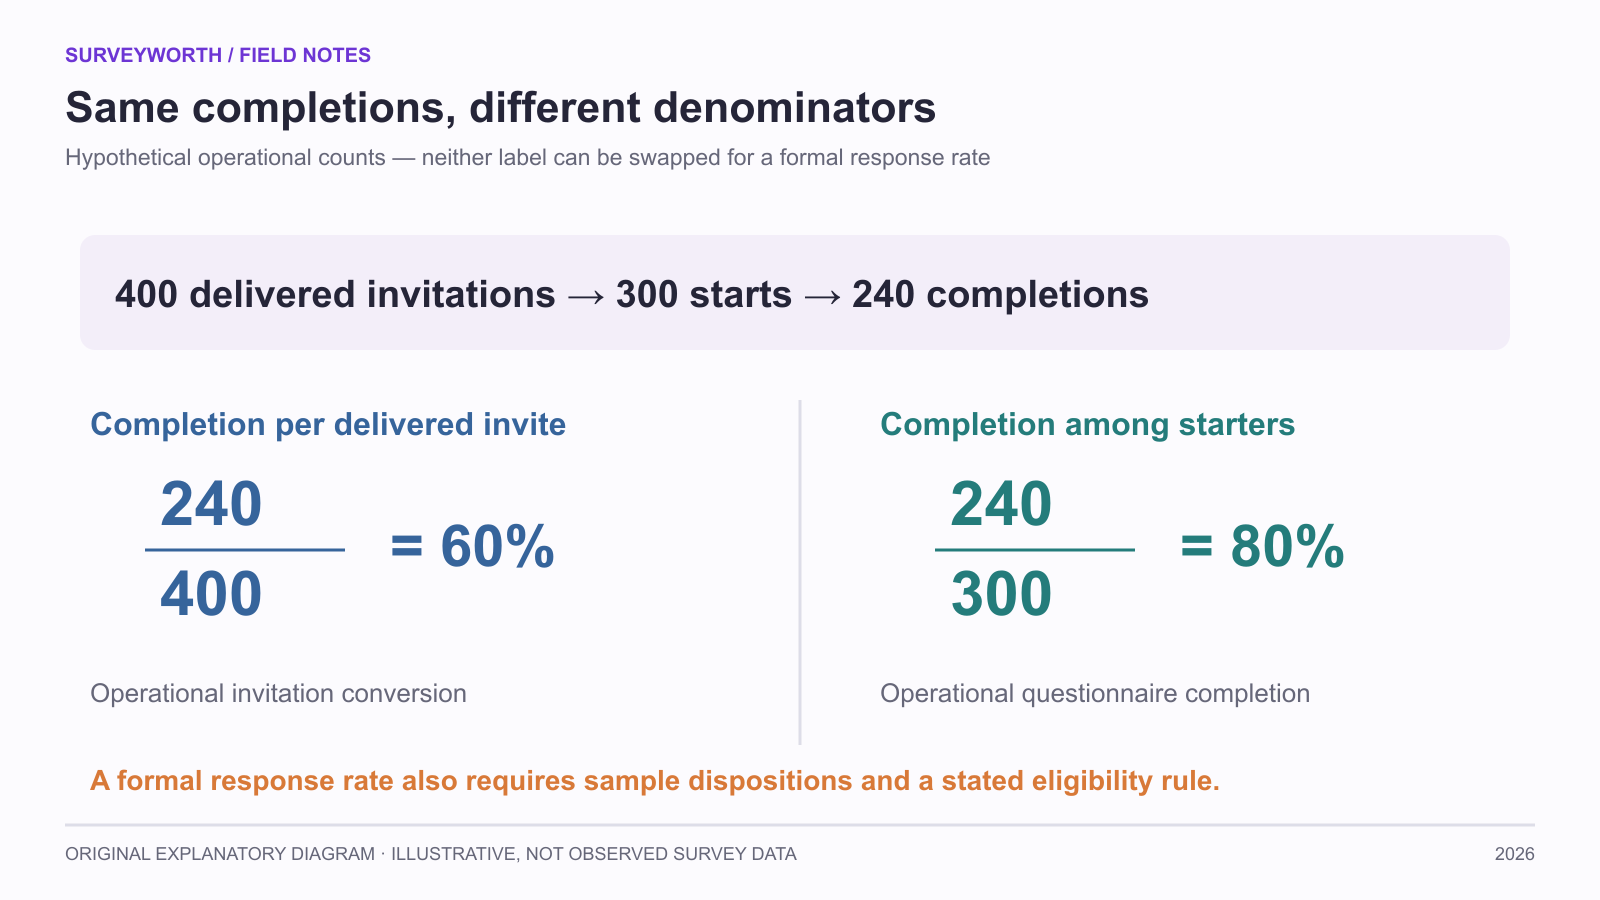
Image source: SurveyWorth original explanatory diagram, 2026. Illustrative, not observed survey data. Based on this article’s “A practical invitation rewrite; Define the metric before trying to raise it” section(s); not a product screenshot.
When testing invitation variants, use qualified completions per delivered invitation as the main operational measure. A catchy subject line can increase opens while attracting people who are not eligible or who leave at the first question. Review respondent composition and completion time as well as the headline rate.
State the response-rate definition before reporting it
For an illustrative invitation list, suppose there are 500 sampled records: 300 eligible completed interviews, 50 eligible partial interviews, 50 known eligible noninterviews, 20 known ineligible records, and 80 records with unknown eligibility. Under AAPOR's standard definitions, the exact response-rate formula depends on which response-rate variant you choose, whether partials count, and how unknown eligibility is estimated. Do not simply report 300/500 as “the response rate” or remove all 80 unknown cases without explanation.
If these are the final disposition groups and the 50 eligible noninterviews are refusals, noncontacts, or other eligible cases, AAPOR RR1 is I / (I + P + eligible noninterviews + unknown eligibility) = 300 / (300 + 50 + 50 + 80) = 62.5%. The 20 known ineligible records are excluded. Other AAPOR variants count partials or estimate eligibility differently; label the exact variant you report.
For an operational dashboard, you may separately report an email completion fraction such as completed surveys divided by delivered invitations, but label it exactly that way. It is not automatically an AAPOR response rate. Preserve final disposition codes for every sampled case, show the chosen formula in the methods note, and report starts and item-level dropout separately. A higher invitation conversion number is useful for improving the workflow, yet it does not by itself establish representativeness. See AAPOR's Standard Definitions for the formal rate variants and eligibility handling.
Diagnose the funnel before adding an incentive
Involve.me’s response-rate strategies discuss invitations, length, reminders, and incentives; its email-subject guidance focuses on the first impression. These are possible interventions, not evidence that every survey needs a prize. Start with the stage at which people stop. A low delivered-to-open ratio suggests sender or subject recognition; a low open-to-start ratio suggests invitation mismatch; a low start-to-submit ratio suggests questionnaire friction. Keep formal survey response-rate reporting separate from this operational funnel.
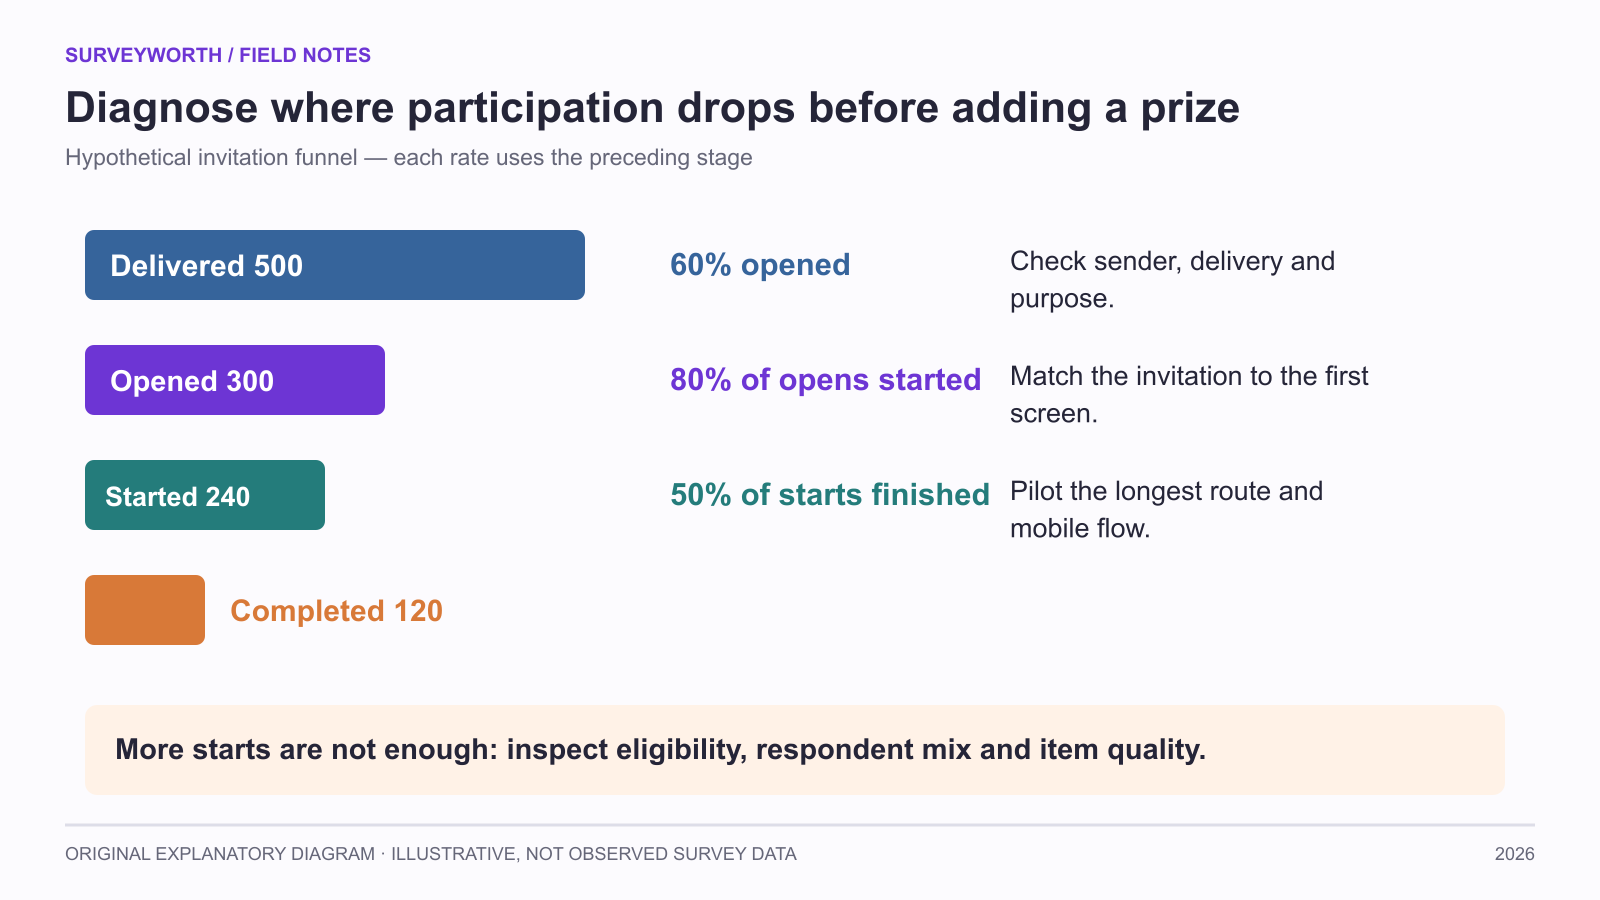
Image source: SurveyWorth original explanatory diagram, 2026. Illustrative, not observed survey data. Based on this article’s “Diagnose the funnel before adding an incentive; Compare invitation tests without hiding composition” section(s); not a product screenshot.
| Funnel observation | First check | Small test |
|---|---|---|
| Few opens | Deliverability, sender, subject | A clearer purpose line. |
| Many opens, few starts | Eligibility and landing-page promise | Match the invitation to the first screen. |
| Many starts, few completions | Long branch, mobile failure, sensitive item | Pilot the longest route. |
QuestionPro’s response-rate explanation provides common calculations, but methods differ; use a named denominator and disclose unknown eligibility. If an incentive is tested, compare the composition and answer quality as well as the completion count. The survey-length guide helps test whether burden is the actual obstacle.
Compare invitation tests without hiding composition
If one subject line produces more starts, check whether the added respondents resemble the target group and answer the same core items. A high-conversion message can attract people seeking a reward rather than people with the relevant experience. Involve.me’s incentive overview lists common incentives; it does not establish that any incentive improves data quality in every survey. Alchemer’s email-delivery advice addresses a different failure point: messages that never reach the inbox. Randomize invitation variants within the same eligible frame when possible, preserve delivered counts, and compare completion and item missingness. Do not label an open-rate lift a survey response-rate lift.
Frequently asked questions
What response rate should I target?
There is no universal benchmark that fits every audience and channel. Focus on coverage, nonresponse patterns, and whether the resulting data support your decision.
Will a larger incentive fix poor wording?
No. It may draw more starts, while confusing questions still reduce data quality.
Are open rates the same as response rates?
No. An email open is an invitation-funnel event; survey response-rate calculations require a defined sample and disposition rules.
Choose tools for your next survey.
Explore survey creation software and research tools for your project.
Explore survey softwareKeep reading.

How to Test a Marketing Campaign With Surveys
Use surveys before, during, and after a campaign to test message clarity and track audience response without overclaiming causality.
Read the guide
How to Measure Brand Awareness With a Survey
Measure unaided recall and aided recognition with balanced survey questions and careful sampling.
Read the guide
How to Design a Product Testing Survey
Write product concept, prototype, and post-launch survey questions that fit what participants have actually experienced.
Read the guide