
How to Spot Bots, Duplicates, and Low-Quality Survey Responses
Use proportionate checks for duplicate, automated, and inattentive survey responses without discarding honest participants.

Bad survey data can come from bots, duplicate entries, ineligible respondents, or people answering without reading. A single fast completion or unusual opinion is not proof of fraud. Use several signals and document your decisions.
Separate three different problems
An ineligible person may answer carefully but should not be included in a study of a different population. A duplicate respondent may give genuine answers twice and distort counts. An inattentive or automated entry may satisfy eligibility on paper but provide unreliable data. Label these problems separately; a single “bad response” bucket hides what went wrong and how to prevent it.
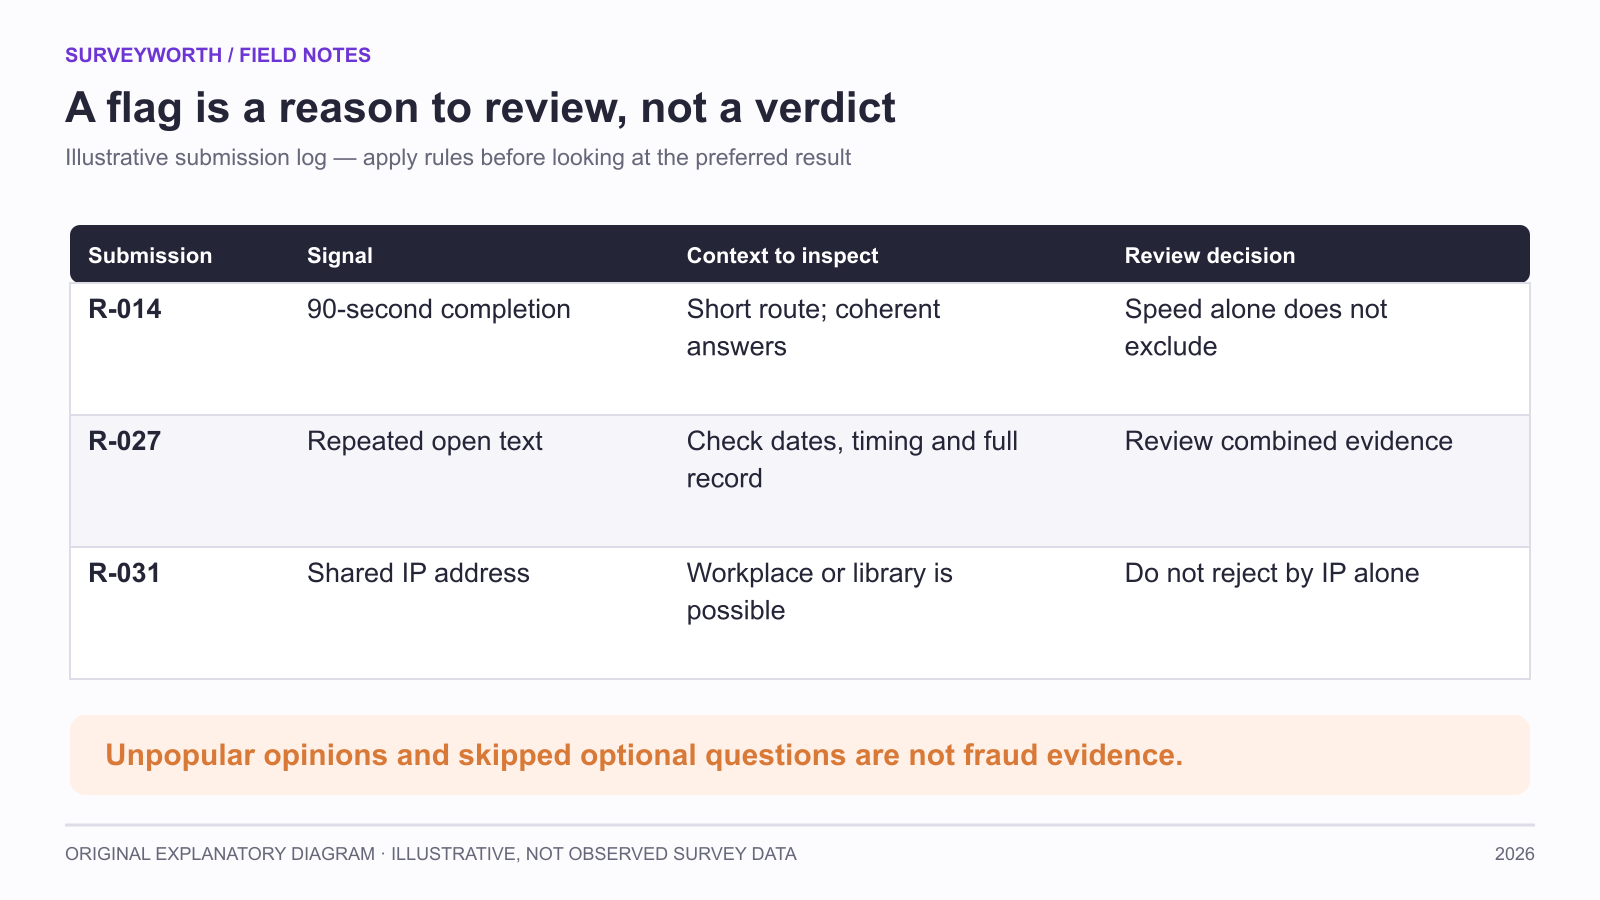
Image source: SurveyWorth original explanatory diagram, 2026. Illustrative, not observed survey data. Based on this article’s “Separate three different problems; Build a predeclared flag system” section(s); not a product screenshot.
The first defense is a good recruitment design. A public link paired with a large incentive and explicit qualification criteria can invite opportunistic submissions. Use neutral screening, appropriate distribution controls, and clear incentive terms. If the study requires unique people, choose a duplicate-control method and check that it does not contradict anonymity claims.
Build a predeclared flag system
Possible flags include impossible chronology, inconsistent answers to closely related factual items, repeated identical free text across many entries, unusually fast completion for a long route, and technical evidence of bulk automated submission. None should automatically prove fraud. A respondent who knows the topic well may finish quickly; a shared office network may produce several valid entries from one IP address. Assess a combination of signals and the study context.
For example, an entry that completes in 90 seconds might be plausible on a short branch. The same time paired with a lengthy open response copied identically across many entries and impossible eligibility answers is stronger evidence of a problem. Keep a record of the rule, the evidence, and the decision for each excluded case. Do not create a new rule after seeing which exclusions improve a desired result.
Compare the findings with and without flags
Preserve raw data. Create analysis versions with all eligible responses, with clearly invalid entries removed, and, if needed, with borderline flagged entries excluded. If the central result changes substantially, disclose that sensitivity. A stable result is reassuring but does not prove the remaining responses are perfect.
Do not punish legitimate respondents with arbitrary attention checks. A trick question can confuse people using assistive technology or those reading in a second language. If you include an attention item, ensure it is clear, relevant, and only one part of a broader quality review.
Make privacy part of quality control
Device fingerprints, IP addresses, and unique links can help detect repeat entries, but they also create identifying data. Decide whether you truly need them, who can access them, and how long they are retained. If a survey is advertised as anonymous, verify that the anti-fraud setup supports that claim. Research quality includes honest disclosure about how the data were collected.
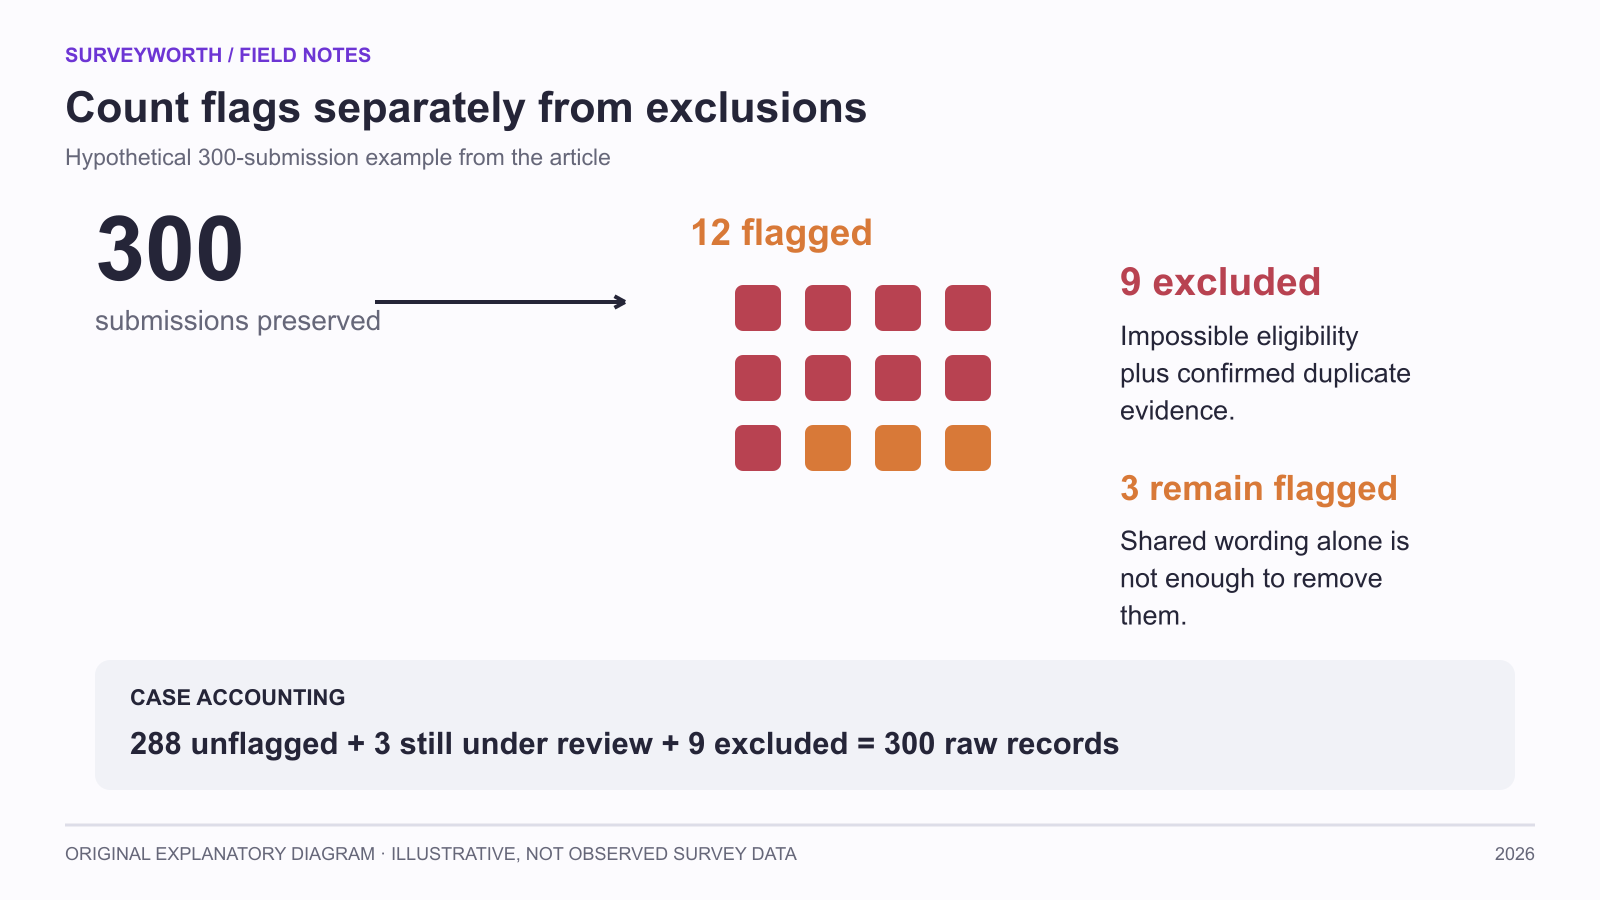
Image source: SurveyWorth original explanatory diagram, 2026. Illustrative, not observed survey data. Based on this article’s “A worked review decision; Compare the findings with and without flags” section(s); not a product screenshot.
A worked review decision
Imagine 300 submissions to an incentivized survey. Twelve share the same short open answer and arrive within a minute. Of those twelve, nine also claim mutually impossible purchase dates and have near-identical completion times. Flag the cluster and examine platform logs under your privacy rules. If the nine entries have confirmed impossible eligibility and duplicate technical evidence, exclude them under the predeclared rule; leave the other three flagged for review instead of rejecting them for shared wording alone. Document every decision and rerun the main analysis with and without borderline entries.
Do not create a “quality score” that automatically removes people who give unpopular views or skip optional questions. Some legitimate respondents have little to say. A transparent rule focused on eligibility, coherence, and technical evidence is more defensible than a black-box judgment of whether an answer looks useful.
Review suspicious cases with a documented rule
Nielsen Norman Group’s survey-bot analysis identifies patterns such as implausible timing, repeated text, and unusual bursts. Cint’s quality discussion adds the value of screening and checking responses during collection. None of those signals is conclusive alone: a fast reader, a shared office network, or a person using assistive technology could be incorrectly removed. Make the review unit a submission, and predeclare which combinations trigger manual inspection.
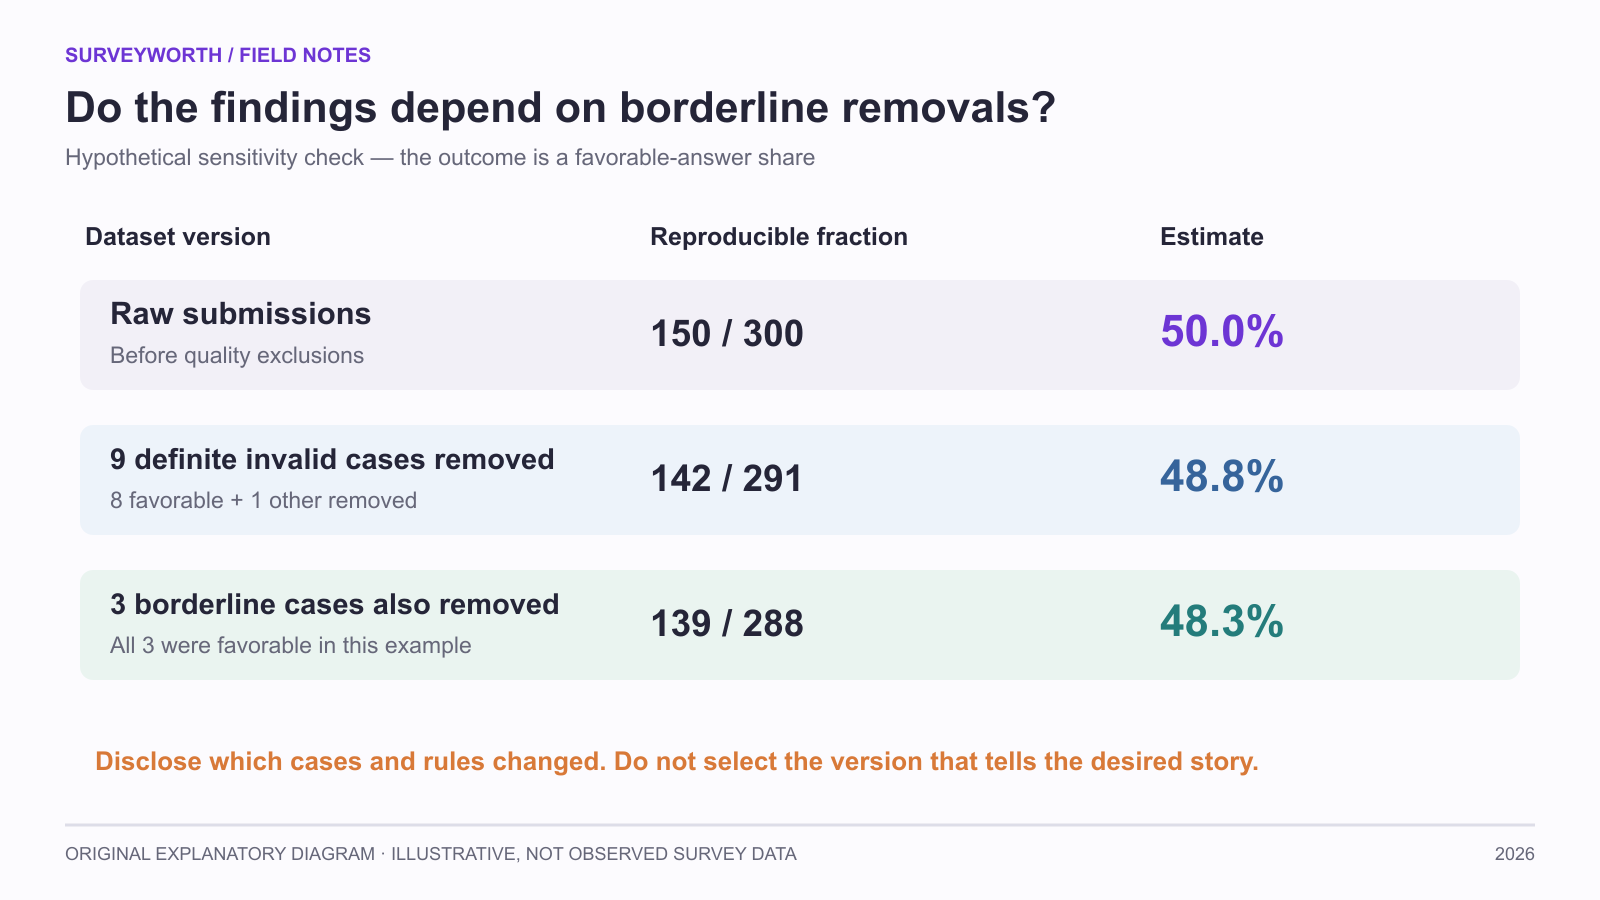
Image source: SurveyWorth original explanatory diagram, 2026. Illustrative, not observed survey data. Based on this article’s “Compare the findings with and without flags; Protect the good responses you might wrongly remove” section(s); not a product screenshot.
| Signal | Possible innocent explanation | Follow-up check |
|---|---|---|
| Very short duration | Familiar topic or saved progress | Compare route length and answer coherence. |
| Repeated free text | Common wording in a short prompt | Check whether other answers are duplicated. |
| Shared network | Workplace or library | Look for bursts and repeated patterns, not IP alone. |
Keep three counts in the quality log: all submissions, cases flagged for review, and cases actually excluded under the rule. Rerun the main estimate with and without borderline cases; a large change is a limitation to report. QuestionPro’s data-quality overview describes platform controls, but vendor controls need local validation against the actual survey. The analysis workflow shows how to preserve those exclusion decisions.
Protect the good responses you might wrongly remove
A participant using a screen reader may take a different path and time than someone using a mouse; a family may share one IP address. Use multiple signals and a human review before exclusion. W3C’s accessible-form guidance is relevant when a quality rule interacts with input method, while Jotform’s survey-bias overview reminds analysts that filtering decisions themselves can bias the result. In the final report, show the estimate with all eligible records, with definite invalid cases excluded, and with borderline cases excluded. If the conclusion changes across those versions, say so. The goal is a defensible dataset, not the largest possible deletion count.
Choose tools for your next survey.
Explore survey creation software and research tools for your project.
Explore survey softwareKeep reading.

How to Test a Marketing Campaign With Surveys
Use surveys before, during, and after a campaign to test message clarity and track audience response without overclaiming causality.
Read the guide
How to Measure Brand Awareness With a Survey
Measure unaided recall and aided recognition with balanced survey questions and careful sampling.
Read the guide
How to Design a Product Testing Survey
Write product concept, prototype, and post-launch survey questions that fit what participants have actually experienced.
Read the guide