
What Is a Survey? A Practical Guide From Research Goal to Action
Learn what a survey is, when to use one, and how to turn responses into decisions with a practical start-to-finish workflow.

A survey is a structured way to ask a defined group of people comparable questions, with relevant branches when needed. It can describe what respondents report, compare groups, or track change. Its value comes from a decision it helps you make, not from collecting answers for their own sake.
Build a one-page survey brief
Before drafting a form, write down five things: the decision owner, the population, the decision deadline, the specific evidence needed, and the action that may follow. This brief prevents a survey from becoming a collection of questions suggested by every stakeholder. If a proposed question has no clear place in the brief, ask why it belongs.
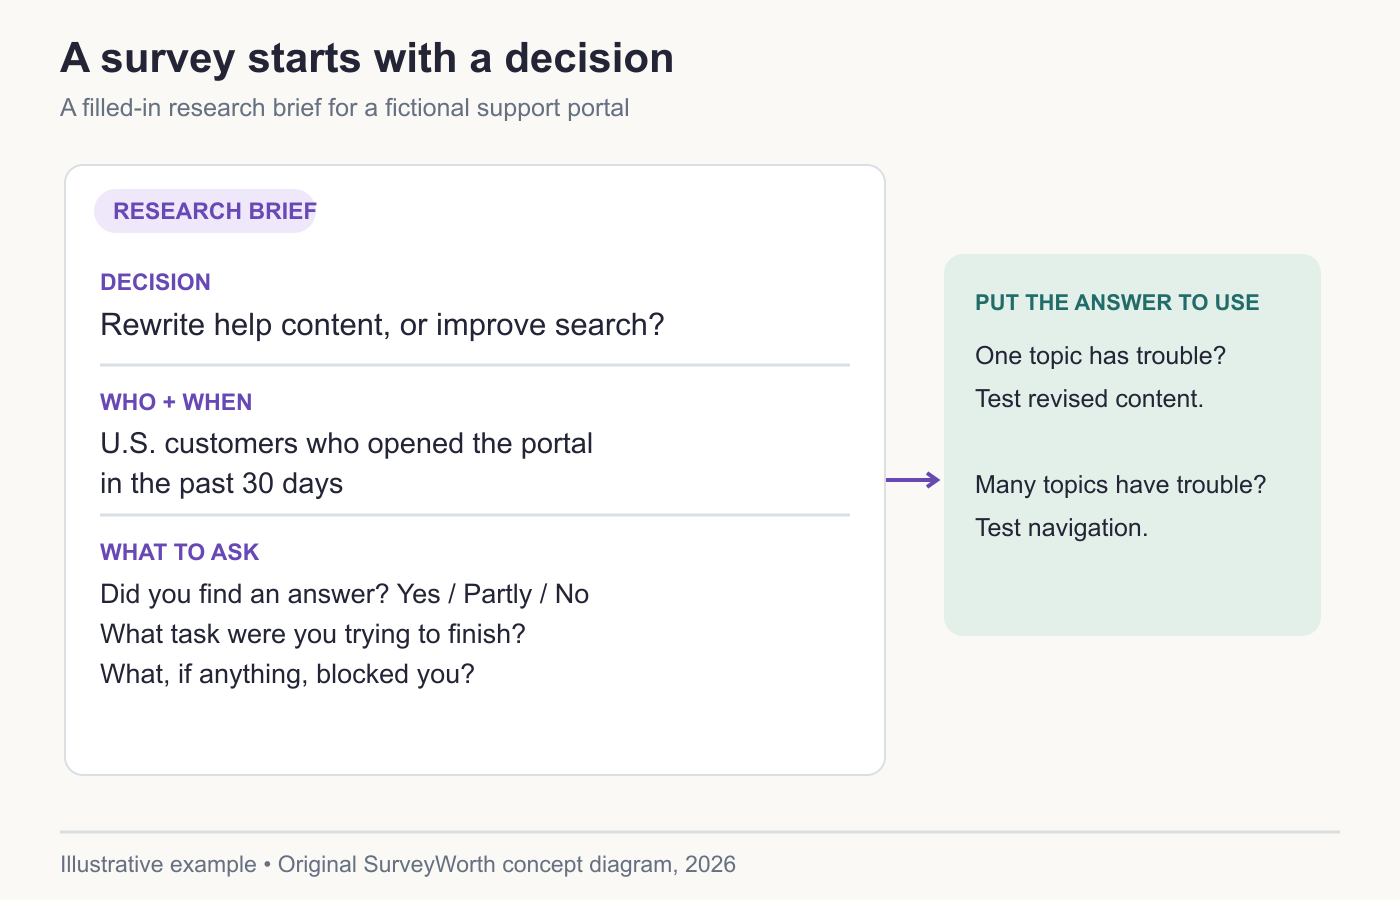
Image source: Original SurveyWorth conceptual diagram, 2026. Illustrative, not observed data or a product screenshot. Based on “Build a one-page survey brief”.
Consider a fictional support portal whose team wants to reduce repeat contacts. “Are customers happy?” is too broad. A workable brief is: “We will ask U.S. customers who opened the support portal in the last 30 days whether they found an answer, what task they attempted, and what blocked them, so the team can decide whether to rewrite help content or improve search.” Now the population, recall window, measures, and possible actions are explicit. The team can also compare answers with site events under its privacy commitments.
Choose the measurement before writing questions
A survey can measure a reported event (“Did you contact support?”), an evaluation (“How satisfied were you with the resolution?”), or an attitude (“How confident are you that the problem is fixed?”). These are different constructs. A person may report that support was courteous while still saying the problem is unresolved. If you combine courtesy and resolution in one item, you cannot tell which part needs work.
Create a small mapping table: research question, survey item, response format, planned analysis, and decision. For the support-portal example, ask whether the visitor found an answer—Yes, Partly, or No—then ask what task they were attempting. An optional open response can reveal whether the obstacle was missing content, unclear wording, or search navigation. Tabulate task and outcome separately before interpreting the comments.
Design the fieldwork as carefully as the form
Decide who receives an invitation and how many times they can be asked. If the survey goes only to customers who open marketing email, people who avoid those messages are missing. If the form appears only after a successful order, it cannot describe people who left checkout. A clean question cannot repair a poorly chosen audience.
Record the collection window, invitation channel, number invited, eligibility rule, and number who answered each key item. If you cannot know the number invited because a public link was shared, do not invent a response rate. You can still describe the respondent group and use the answers for exploration.
Interpret an answer at the right level
Suppose 60 of 100 respondents say they did not find an answer. You can report that 60% of those 100 respondents selected that option. You cannot automatically say 60% of all portal visitors had the same problem. The latter claim depends on how the 100 were selected, who did not answer, and whether the question was understood consistently. AAPOR best practices recommend disclosing the target population, sampling, fieldwork, and weighting behind a reported survey result. Percentages should carry a clear denominator and population label.
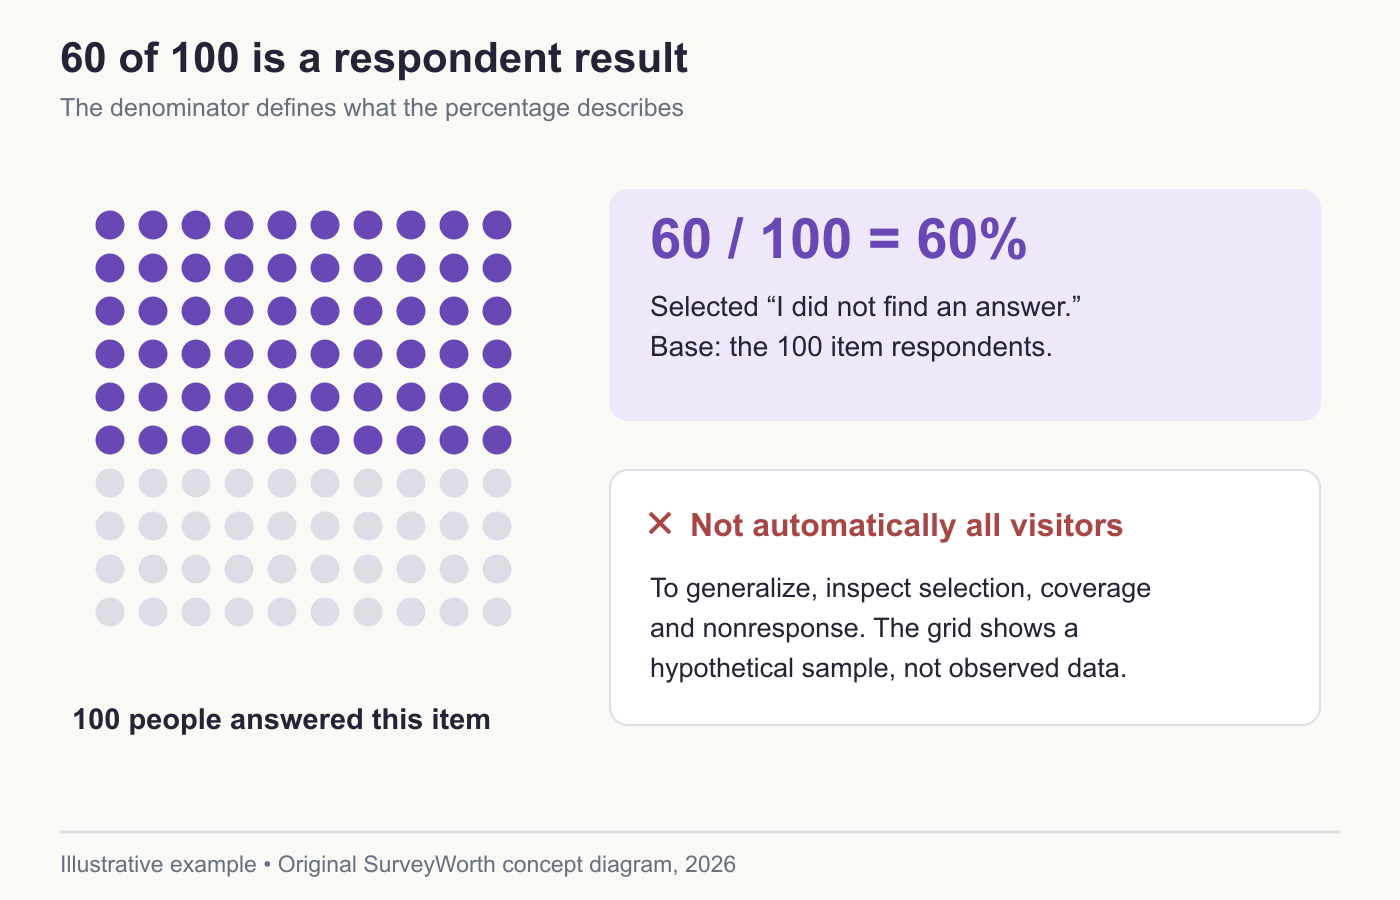
Image source: Original SurveyWorth conceptual diagram, 2026. Illustrative, not observed data or a product screenshot. Based on “Interpret an answer at the right level”.
Finally, decide who will inspect the result and when. A short survey that leads to a tested change is more valuable than an elaborate survey with no owner. Publish a plain account of what was heard, what action was taken, and what remains uncertain. This is especially important when respondents volunteered time to help.
A reusable survey brief
Use this sentence to start a project: “By [date], [owner] will decide [action]. We need to know [measure] among [population] who experienced [event] during [period]. We will recruit through [channel], and we will treat the result as [population estimate or exploratory feedback].” Fill every bracket before adding questions. If two stakeholders fill it differently, resolve the disagreement first; a questionnaire cannot answer two incompatible briefs at once.
A filled-in survey brief you can adapt
| Brief field | Hypothetical support-portal study |
|---|---|
| Decision | Decide whether to rewrite help articles or improve the search interface. |
| Population | U.S. customers who opened the support portal in the last 30 days. |
| Evidence needed | Whether visitors found an answer, the task they attempted, and what blocked them. |
| Collection | Invite a sample after the visit; keep the invitation separate from the live support task. |
| Analysis | Report the share answering yes, partly, or no; code the optional obstacle text by task. |
| Action rule | If failed searches cluster around a specific article topic, test revised content; if they cluster across topics, test navigation. |
This is a planning example, not a claim about SurveyWorth customers. Before launch, define who counts as a portal visitor, whether repeat visits are deduplicated, and what you will do with visitors who do not remember their task. A brief helps the team decide which questions are necessary. If a proposed item does not inform the decision or explain a limitation, remove it. After fieldwork, put the actual sample, field dates, and any deviation from this plan beside the findings.
Decide what the support-portal survey can establish
Nielsen Norman Group’s survey-method article distinguishes reported attitudes from observed behavior; Typeform’s online-survey workflow moves from research goal through recruitment and analysis to action. For the support-portal example, the survey can ask whether eligible visitors report finding an answer and what blocked them. Site logs can show searches, article views, and later contact. A usability test can show how someone interprets a confusing result page. Those are complementary forms of evidence, not interchangeable measurements.
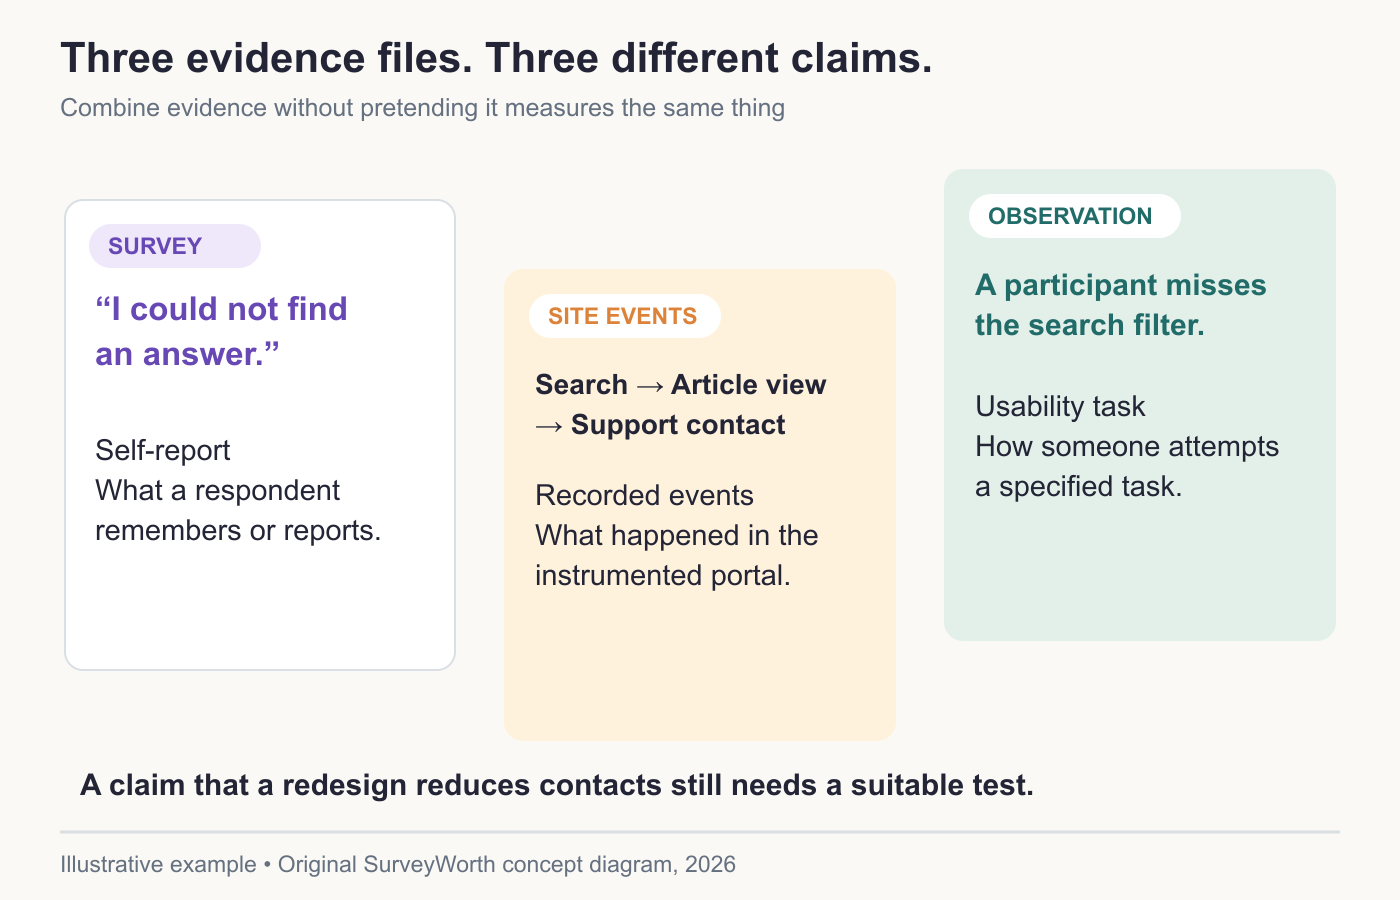
Image source: Original SurveyWorth conceptual diagram, 2026. Illustrative, not observed data or a product screenshot. Based on “Decide what the support-portal survey can establish”.
| Claim | Evidence needed |
|---|---|
| “60 of 100 respondents could not find an answer.” | Valid item answers and a stated denominator. |
| “The same issue affects all portal visitors.” | A design supporting inference to that population and nonresponse analysis. |
| “Changing search will reduce contacts.” | A suitable test of the new experience and contact outcomes. |
Hotjar’s analysis sequence connects findings to a decision, but it does not remove the need to document selection and uncertainty. Put the sample and field period next to every result. If the team has not defined an action owner, stop and refine the brief before adding questions. The method-choice guide helps decide when the next step should be observation rather than another survey.
Keep the survey brief and the report aligned
If the brief says “recent U.S. support-portal visitors,” the report should not become “all U.S. customers.” If the invitation goes only to logged-in visitors, state that narrower group. AAPOR’s reporting standards give the disclosure categories for population, selection, mode, field dates, and weighting. Typeform’s market-research guide offers a project-level sequence, but the final claim must match the actual sample. Archive the exact questionnaire, route, and item bases with the decision memo. The survey-design guide expands the brief into a build and pilot plan. Then the next team can distinguish what respondents said from what the portal log showed and evaluate whether a page change addressed the problem.
Frequently asked questions
Is a poll the same as a survey?
A poll usually captures a quick choice on a narrow topic. A survey can explore multiple related questions and support a more detailed analysis.
Do surveys prove cause and effect?
Usually no. A reported association can suggest what to investigate, but a controlled experiment or other stronger design is needed for a causal claim.
Choose tools for your next survey.
Explore survey creation software and research tools for your project.
Explore survey softwareKeep reading.

How to Test a Marketing Campaign With Surveys
Use surveys before, during, and after a campaign to test message clarity and track audience response without overclaiming causality.
Read the guide
How to Measure Brand Awareness With a Survey
Measure unaided recall and aided recognition with balanced survey questions and careful sampling.
Read the guide
How to Design a Product Testing Survey
Write product concept, prototype, and post-launch survey questions that fit what participants have actually experienced.
Read the guide